Uniformity & Asymmetry
Basic Concepts
This section will consider some general aspects of amplitude uniformity, consider why asymmetry is also important, and look at how uniformity and asymmetry are calculated.
Definition
Amplitude uniformity (generally just "uniformity") is a measure of how much the amplitude varies over a given surface.
Need for uniform horns
Consider an ultrasonic plastic welding application in which two very compliant strips of uniform thickness are to be welded together. To get uniform welding along the joint, an equal amount of ultrasonic energy must be delivered to each point along the weld joint. Since energy delivery is a function of the horn amplitude, equal energy delivery requires equal horn amplitude at each location where the horn contacts the strip. If the horn face amplitude is not uniform, then some section of the joint may be underwelded while other sections are overwelded. Thus, the uniformity of horn face amplitude is an important consideration in horn design. (Note: for the time this discussion will be confined to horn face uniformity. However, amplitude uniformity on the stud surface is also important as will be discussed later.)
The precise uniformity requirements will depend on the application. Rigid plastics are somewhat tolerant of nonuniform horns. This is because the stiff plastic can transmit ultrasonic energy to adjacent joint areas, which results in a more uniform energy distribution along the joint. Also, rigid plastics permit joints (energy directors) that can sometimes compensate for inadequate horn uniformity. Finally, many applications require only a certain average strength, so that some over-welding and under-welding along the joint is permissible.
There are certain circumstances where high uniformity is needed:
- Hermetic seals. A hermetic seal requires adequate joint strength along its entire perimeter. A uniform horn improves the probability of success.
- Thin-film applications. When welding thin-films (such as synthetic fabrics), the film is too flexible to transmit ultrasonic energy to adjacent areas. Also, the film cannot be designed with an energy director. Thus, the entire responsibility for a proper weld lies with the horn.
- Composite horns. A composite horn consists of a mother horn to which tip horns are attached. If the mother horn does not have uniform face amplitude, then the tip horns will flex. This can cause fatigue failure of the tip horns, joint problems between the tip and mother horn, flexure failure of the converter, and problems with spurious resonances.
- High amplitude joints. When a joint operates at high amplitude, the joint may deteriorate due to fretting at the contact interface. This leads to heating and higher power loss; the joint may seize if the problem is severe. This problem will be worse if the joint has high amplitude and if the horn has poor uniformity across the joint.
Cause of nonuniformity
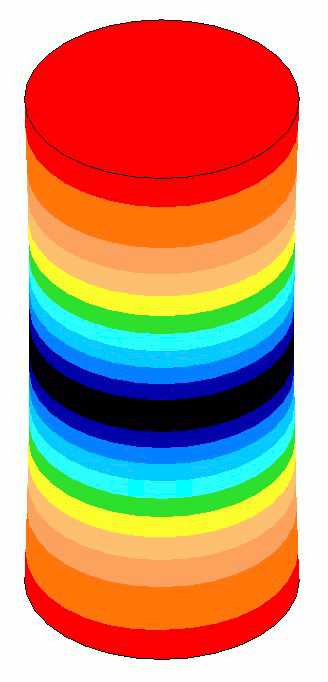
Amplitude nonuniformity is caused by Poisson coupling so that as the resonator vibrates longitudinally it "breathes" laterally. However, this breathing is not uniform along the length of resonator — i.e., the amount of breathing will be greatest where the strain (stress) is highest. Thus, for an unshaped resonator the breathing will be highest at the node and lowest (near zero) at the output and input surfaces. This nonuniform breathing distribution leads to nonuniformity of face amplitude.
The amount of breathing depends three factors.
- Poisson's ratio. Materials with a high Poisson's ratio breathe more and hence have reduced amplitude uniformity.
- Wave speed. Materials with a short tuned length (low wave speed) have greater strain at a given amplitude and, hence, greater breathing.
- Lateral dimensions. Resonators with large widths, thicknesses, or diameters will breathe more than their slimmer counterparts.
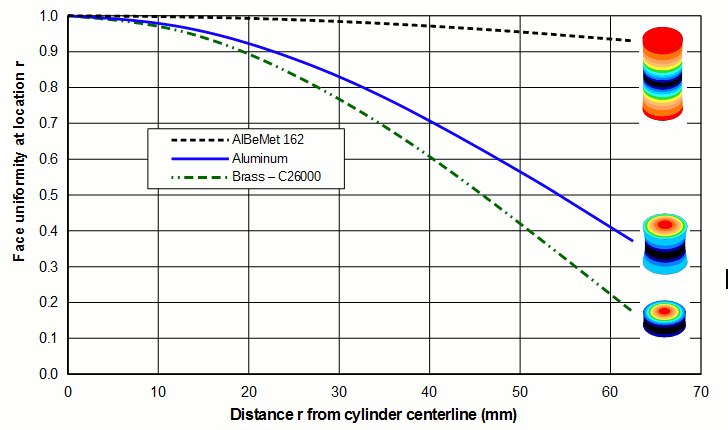
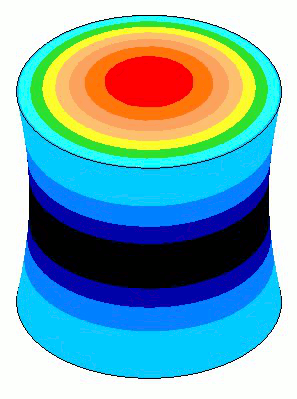
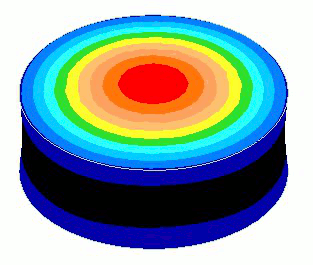
Therefore, to reduce the breathing and improve the uniformity the desired material should have a low Poisson's ratio and high wave speed (long tuned length) and the resonator should be as slim as possible. The following graphs show some of these effects.
| Material | Young's modulus | Density | Poisson's ratio | Thin-wire wave speed | Uniformity | Image |
|---|---|---|---|---|---|---|
| AlBeMet 162 | ||||||
| Aluminum | ||||||
| Titanium | ||||||
| Steel | ||||||
| Brass (C26000) |
|
|
|
|
|||||||||||||||
|
|
|
 |
Uniformity calculation
A calculated value of uniformity should have the following characteristics:
- It should be relatively easy to determine (implement).
- It should correlate strongly to the performance of the horn (i.e., a horn with a high uniformity should perform better than an equivalent horn with low uniformity).
- It should allow easy comparison among various data sources (empirical amplitude measurements, FEA 3D, FEA axisymmetric, etc.).
- It should be repeatable.
The simplest equation for uniformity is:
| 1) Ŵ | = | Ūmin | |||
| Ūmax |
where:
| Ŵ | = uniformity |
| Ūmin | = average minimum axial amplitude on a specified surface |
| Ūmax | = average maximum axial amplitude on a specified surface |
Notes:
- Depending on the circumstances, uniformity can be expressed either as a decimal value or as a percent. For example, a uniformity of 0.92 is equivalent to a uniformity of 92%. Here the decimal value will generally be used.
- Unless otherwise specified, all amplitudes used to calculate the uniformity are axial.
- The "specified surface" will typically be the output surface. Occasionally (as will be indicated) the "specified surface" will be the input surface (e.g., when dealing with joint problems).
- The "specified surface" may not necessarily encompass the entire surface. See Contact uniformity below.
- Ūmin is the average from symmetric (geometrically equivalent) locations on the specified surface where the amplitudes are a minimum; similarly for Ūmax. This is necessary because horns sometimes have asymmetric amplitude distributions, even though the horn itself is nominally symmetric with respect to the stud axis. This will become clearer below with some examples.
- The uniformity calculated from equation 1 will always have a value less than or equal to 1.0. (Note: the central uniformity (below) may have a value greater than 1.0.)
- Well-designed horns should have high uniformity. Therefore, the best possible uniformity will be 1.0 when every face amplitude is identical. The worst possible uniformity will be 0.0 when the minimum amplitude is zero. If the specified surface has a node then the uniformity is automatically zero.
While equation 1 is fairly easy to implement, the correlation with horn performance may not be particularly good. See Appendix A.
Example 1: Ø101 mm unshaped, unslotted, solid cylindrical horn
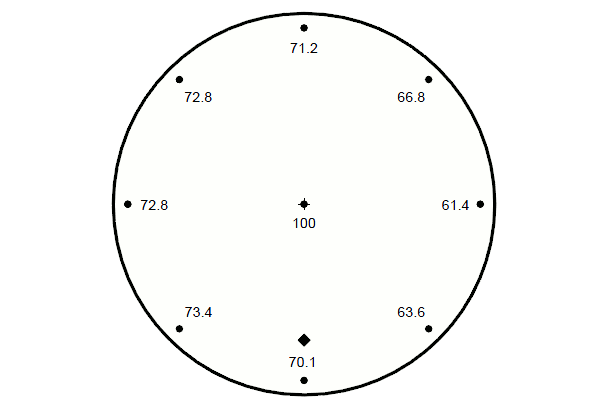
For a particular Ø101 mm unshaped solid cylindrical horn, the measured relative amplitudes are shown in the figure below.
|
|
|
According to the requirements of equation 1, the amplitudes must be averaged from locations on the horn that are "geometrically equivalent" — i.e., locations that would not be distinguishable from each other if the horn were rotated while an observer were blindfolded. For all unshaped cylindrical horns, the minimum face amplitude will be at the periphery. For a cylinder, any peripheral location is indistinguishable from any other peripheral location. Therefore, choosing eight equally spaced peripheral locations (a reasonable sample), the average minimum amplitude is (proceeding clockwise from the diamond reference mark):
| Ūmin | = | 70.1 + 73.4 + 72.8 + 72.8 + 71.2 + 66.8 + 61.4 + 63.6 |
| 8 |
| Ūmin | = | 69.0 |
Thus, the average minimum amplitude (69.0) to be used in equation 1 is greater than the actual measured minimum amplitude (61.4).
What about the maximum amplitude? From the available data, the highest amplitude is at the center of the horn face (100). Since there is no other location on the horn that is geometrically equivalent to the center, then 100 microns is the correct value to use for the maximum amplitude.
Thus, the face amplitude uniformity is:
| Ŵ | = | 69.0 | |||
| 100 |
| Ŵ | = | 0.69 |
If the actual measured minimum amplitude (61.4 microns) had been used in equation 1 then the calculated (incorrect) uniformity would have been:
| Ŵ | = | 61.4 | |||
| 100 |
| Ŵ | = | 0.61 |
Number of measurements
In the above example, eight measurements were made around the periphery. Using only four measurements would have given nearly the same results. Starting at the location closest to the diamond reference mark and taking every other amplitude reading (four total), the averge minimum amplitude is 68.9 for which the uniformity is 0.689. Starting at the measurement just clockwise from the reference mark and taking every other amplitude reading (four total), the averge minimum amplitude is 69.2 for which the uniformity is 0.692. Hence, four amplitude measurements would have been sufficient for this horn.
Central uniformity
In some cases it is convenient to define a the central uniformity. In this case, the reference amplitude (in the denominator of equation 1) is the amplitude at the center of the chosen face, regardless if this is the largest average amplitude:
| 2) Ŵcentral | = | Ūmin or Ūmax | |||
| Ūcentral |
Note that the stud centerline amplitude is not necessarily used for the numerator.
This definition is normally used only when all of the surface amplitudes are either larger or smaller than the centerline amplitude. If all of the amplitudes are larger than the centerline amplitude, then the uniformity will be greater than 1.0 and the surface is said to have amplitude rise. Conversely, if all of the amplitudes are smaller than the centerline amplitude, then the uniformity will be less than 1.0 and the surface is said to have amplitude droop.
This definition is especially useful for plotting graphs of uniformity versus another parameter (e.g., an altered horn dimension). See zzz for an example of this type of graph.
Contact uniformity
Some applications are welded only along in certain areas of the horn face (i.e., where the horn contacts the plastic part). Then the overall face uniformity is not important; only the uniformity over the contact area matters.
Peripheral uniformity
For a horn that contacts only around the periphery of the face, the peripheral uniformity is:
| 3) Ŵperiphery | = | Ūmin (periphery) | |||
| Ūmax (periphery) |
Example. This definition is especially useful for large cylindrical and rectangular horns.
Circular uniformity
When welding a circular part the "obvious" choice is a cylindrical horn. However, sometimes a block horn will have better performance (e.g., better uniformity over the contact area, better frequency separation, better life, etc.). When a block horn is thus used, the uniformity within the circular contact area is:
| 4) Ŵcircular | = | Ūmin (within circle) | |||
| Ūmax (within circle) |
Peculiarities
Consider a peculiar situation in which the horn has rather extreme asymmetry. Figure í2Ê«» shows the amplitude distribution on the face of a 100 mm diameter spool horn (HRD 064 5). The highest face amplitude is 21.7 microns, which actually occurs at the edge of the horn face. Should we use this value as the maximum amplitude in equation ó4Â to calculate the uniformity? No! Remember that you must find an average of all amplitudes at locations that are geometrically equivalent. In this case, there are seven other amplitude measurements whose location (at the edge of the horn face) is geometrically equivalent to that of the 21.7 micron measurement. When all eight of these measurements are averaged, the result is 17.7 microns. Since this value is lower than the centerline amplitude of 19.3 microns, then 17.3 microns is the value to use in the numerator of equation ó4Â, while 19.3 microns should be used in the denominator.
As the above examples show, you must be careful to use the correct values in equation ó1Â to calculate the uniformity. If asymmetry were not a problem, then you could just search the horn face for a single highest and lowest amplitude, from which the uniformity could be directly calculated. However, since most horns have some asymmetry you must take multiple amplitude measurements at geometrically equivalent locations, which are then averaged to determine the average minimum and maximum values. How many measurements are needed? This will depend on the geometry of the horn face. We will look at examples in the next sections.
Justification for averaged amplitudes
Equation 1 uses averaged amplitudes from "geometrically equivalent locations" rather than just using the smallest and largest amplitudes. There are two reasons:
- Using averaged amplitudes exposes certain uniformity relations that would otherwise be obscured by the horn asymmetry. In particular, it appears that the uniformity as given in equation 1 is reasonably unaffected by the amount of horn asymmetry. (For data that supports this conclusion, see the section on "Face Uniformity for Solid, Unslotted Cylindrical Horns; Effect of Asymmetry on Uniformity".) This is not true if we simply divide the smallest measured amplitude by the largest measured amplitude.
- When horns are machined to nominally identical dimensions, they may have somewhat different asymmetries. Using averaged amplitudes smoothes out these asymmetries so that the performance of these horns can reasonably be compared to each other or to horns of somewhat different designs.
Asymmetry
Amplitude asymmetry (generally just "asymmetry") is a measure of how much the amplitude varies at geometrically equivalent locations on the horn. Then for a horn with asymmetric amplitude, the uniformity calculation of equation 1 only partially describes the amplitude performance. Therefore, a second parameter (asymmetry) is needed.
Asymmetry is defined as:
| 5) Asymmetry  | = | Highest amplitude – Lowest amplitude | |||
| Highest amplitude |
In this equation, both the maximum and minimum amplitude must be measured on the same surface from geometrically equivalent locations. Also, these amplitudes are the actual measured amplitudes, not averaged amplitudes.
As with uniformity, asymmetry can be expressed either as a decimal value or as a percent. For example, an asymmetry of 0.27 is equivalent to an asymmetry of 27%. Here the decimal value will generally be used.
Looking again at the above Ø100 mm horn, the amplitude is not uniform at the periphery of the horn face. With a maximum amplitude of 73.4 and a minimum amplitude of 61.4, the asymmetry is:
| Â | = | 73.4 – 61.4 | |||
| 73.4 |
| Â | = | 0.16 |
For well-designed horns, the best possible asymmetry will be 0.0 when all amplitudes from geometrically equivalent locations are exactly equal. The worst possible asymmetry will be 1.0 when the minimum amplitude is 0.
Limitations
Equation 5 is not entirely adequate because it doens't consider the distance over which the asymmetry occurs. For example, consider a horn that has an asymmetry of 0.2 over the stud surface. If the diameter of the stud surface is 100 mm then the horn joint might still perform acceptably (depending on the joint amplitude). However, if the diameter of the stud surface is 40 mm then the amplitude gradient is much more severe that for the Ø100 mm horn so the horn joint should be less reliable. However, equation 5 seems reasonable in order to avoid undue complexity. In any case, the asymmetry can simply be specified for a particular region of interest such as the joint (e.g., as Âjoint).
(Note: when calculating either the uniformity or the asymmetry, use only the magnitude of the amplitudes. Do not use the sign that is associated with the phase of the amplitude. The amplitude phase is covered in the chapter on "Modeshape Analysis".)
Appendix A
Limitations of Equation 1
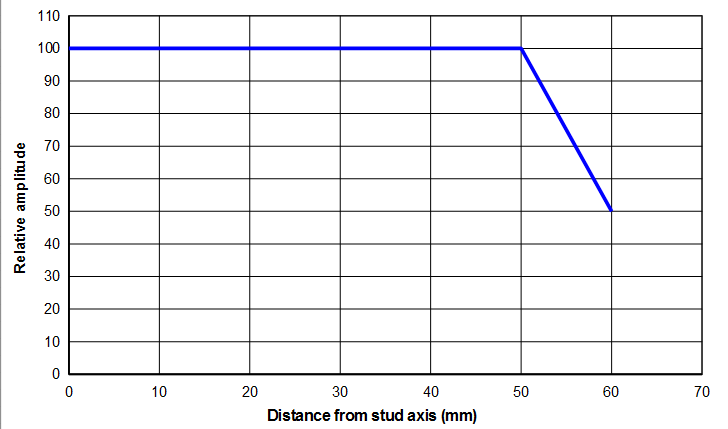
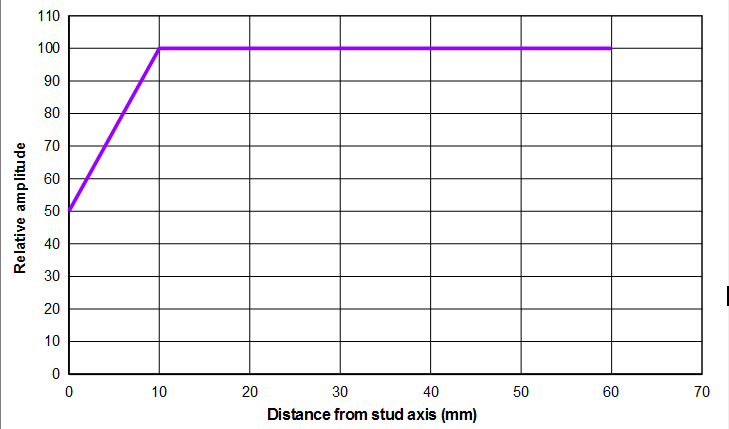
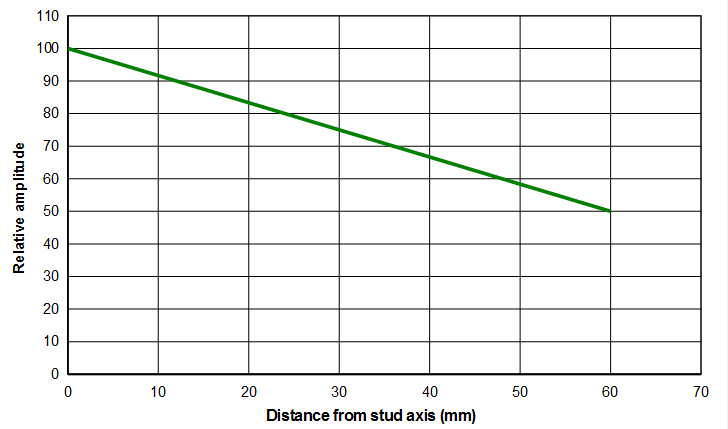
The following figures show hypothetical amplitude distributions for three 120 mm flat faced horn designs. Such discontinuous amplitude distributions would not be seen in actual horns but serve to show the limitations of equation 1. Note that the amplitude distribution starts from the stud axis (i.e., the center of the horn's face) so the amplitude distribution goes from 0 (the stud axis) to 60 mm.
|
|
|
|
|
|
|
|
|
Using equation 1 all of these horns have the same uniformity (0.50). However, it seems rather obvious that Horn C will perform worse than the other two horns. The performance of Horn A and Horn B may also be different but this remains to be seen. Note: even if horn design C were transformed into design A (e.g., by machining), the uniformity as calculated by equation 1 would not change, even though the performance would have obviously have improved.
The following shows how the performance of each horn can be evaluated numerically. For simplicity, assume that the horn is operating in a cavitating fluid. For a cavitation load the power is directly proportional to the amplitude. (See Peshkovsky, figure 9, p. 321.) Consider that the horn face is conceptually divided into a large number n of small areas Ai. Then the local power Pi that is drawn from each of these small areas is:
| A1) Pi | = | k Ui Ai |
where:
| Pi | = local power |
| k | = proportionality constant |
| Ui | = local amplitude |
| Ai | = local area |
The proportionality constant k depends on factors such as the kind of fluid, the temperature and pressure, etc. k may also be affected by certain edge effects that depend on the horn's area but these will be ignored for this simplified analysis (i.e., assume all horns, regardless of size or shape, radiate plane waves.)
Assumptions:
- The horn has no amplitude asymmetry.
- The wave that is radiated from the horn face is plane (i.e., there are no edge effects due to the size of the fluid contact area). This assumption is not true but is acceptable for this analysis of uniformity.
The total power P over the entire surface of the horn is just the sum (∑) of all of the n local powers:
| A2) P | = | k ∑ (Ui Ai) |
It is possible that a large horn with poor uniformity may still deliver more power than a small horn having good uniformity. Therefore, to properly compare the performance of two horns having different areas, the power must be divided by the contact (face) area between the horn and the fluid. This gives the average power over the horn face — i.e., the power intensity Î:
| A3) Î | = | k | ∑ (Ui Ai) | ||
| A |
where:
| A | = total face contact area |
| Î | = power intensity (P/A) |
The quantity [∑ (Ui Ai)/A] can be recognized as the mathematical definition of an average value, which in this case is the average of amplitude Ui over the face.
| A4) Ū | = | ∑ (Ui Ai) | ||
| A |
where:
| Ū | = average face amplitude |
Thus the intensity is directly proportional to the average face amplitude.
| A5) Î | = | k Ū |
In order to compare two horns operating at different amplitudes, Î should be divided by the horn's maximum amplitude Umax. Simultaneously dividing the right side by Umax gives:
| A6) δ | = | Π/ Umax |
| A6) δ | = | k (Ū/Ūmax) |
| A6) δ | = | k Ŵ´ |
where:
| A7) Ŵ´ | = uniformity as defined by Ū/Ūmax |
| A7) Ū | = average axial amplitude over the entire specified surface |
| A7) Umax | = maximum axial amplitude on the specified surface |
Here the uniformity is designated as Ŵ´ to distinguish it from Ŵ of equation 1. δ has units of (Power per unit area per unit amplitude).
Note that this definition of uniformity (equation A7) is different than equation 1 since here the numerator is the average face amplitude rather than the minimum face amplitude. However, this definition now satisfies the requirement that the horn's performance should correlate to the uniformity — i.e., for two horns with the same maximum face amplitude, the one with the greatest uniformity will have the highest intensity.
For the above hypothetical horns, the horn shape could either be rectangular or cylindrical. For a rectangular horn the local area Ai in equation 2 is just (t Δx) where t is the face thickness and Δx is a small increment along the horn's width. For a cylindrical horn the local area Ai in equation 2 is (2π r Δr) where r is the radius where Ai is being evaluated and Δr is a small increment along the horn's radius. Thus, evaluating the uniformities gives:
| Horn | Horn shape | Ŵ (equation 1) | Ŵ´ (equation A7) |
|---|---|---|---|
| A | Rectangular | 0.5 | 0.958 |
| B | Rectangular | 0.5 | 0.958 |
| C | Rectangular | 0.5 | 0.750 |
| A | Cylindrical | 0.5 | 0.921 |
| B | Cylindrical | 0.5 | 0.995 |
| C | Cylindrical | 0.5 | 0.667 |
When applying the uniformity equation 1, all of these horns have the same uniformity, regardless of the amplitude distribution or the horn shape. Therefore, this equation of uniformity gives no indication of which horn will perform best.
In contrast, the uniformity from equation A7 helps to distinguish the horns according to their performance. For the rectangular horns, horns A and B have equal uniformities (0.958) and will deliver equal cavitation power, whereas horn C is less uniform (0.750) and will deliver lower cavitation power.
For the cylindrical horns, horn B has the highest uniformity (0.995). This is because equation A7 is derived from the ability to deliver cavitation power and horn B has greater effective area than horn A. Even though all of the cylindrical horns have the same physical face area, the delivered power depends on the area where the power is delivered; horn B has 100 relative amplitude at its periphery where the circular area of the horn is greatest whereas horn A has lower relative amplitude in this critical region. (Horn A does have better relative amplitude near the stud axis but this region is less effective because the circular area there is less.)
Horn C again finishes last but its uniformity from equation A7 (0.667) is still better than from equation 1 (0.5).
To get a more intuitive feel for the cylindrical horns, consider cylindrical buckets that are each filled with sand to a height h. The sand at the top of each bucket is distributed in the same manner as the amplitude distribution. The bucket with the most sand (the heaviest bucket) will come closest to the "ideal" bucket where the sand is completely level across the top. Bucket B will have the most sand, followed by bucket A and then bucket C. In fact, bucket B will have 99.5% as much sand as a bucket whose sand is completely level.
Special case - all Ai are equal
There is a special case for equation A4 where all of the small local areas Ai are equal; call this value A0. Since A0 is fixed it does not need to be associated with a particular Ui and so can be moved outside the summation. Thus, equation A4 becomes:
| A8) Ū | = | A0 ∑ Ui | ||
| A |
| A8) Ū | = | ∑ Ui | ||
| (A/A0) |
A/A0 can be recognized as the total number n of locations where the amplitude is to be evaluated. Thus, equation A8 becomes:
| A9) Ū | = | ∑ Ui | ||
| n |
The advantage of equation A9 as compared to A4 is that the individual local areas Ai don't have to be considered. In fact, equation A9 is completely independent of the horn contact area. Thus, for scanning laser vibrometer where the measurement points are equally spaced or FEA (for the case where the mesh is relatively uniform), the uniformity can be calculated reasonably easily by using equation A9 in equation A7:
Problems
Although equation A7 is conceptionally appealing, it may be difficult to implement in practice.
- A large number of measurements must be taken in order to determine an average amplitude Ū, especially if the horn has any asymmetry. This would be cumbersome if the amplitudes were measured by hand. However, this could easily be accomplished by something like a scanning laser vibrometer or FEA since the amplitude values can be taken from the mesh nodes.
- Equation A9 only applies when the locations of amplitude measurement are equally spaced so that all of the local Ai are the same. For FEA there are many situations where this is not true. For example, when slots are reasonably close to the face, the face mesh near the slot ends will be finer than the surrounding mesh. Then equation A9 can't be used because the finer local mesh would have undue influence; instead, equation A7 must be used. However, equation A7 involves the average amplitude Ū (equation A4) which can only be evaluated if the local areas Ai can be determined for each local amplitude Ui. However, the Ai are typically not available directly from the FEA although these might be obtained by massaging the raw FEA data.
- When FEA analyzes only a subsection of the horn (for example, a quarter section of a cylindrical horn), equation A9 would give full weight to the amplitudes at nodes at the subsection boundary. In fact, these amplitudes should only be given half-weight since these nodes in the full model are actually shared between the adjoining sections. Thus, the uniformity calculated using equation A9 for a subsection will not agree with the uniformity if equation A9 had been applied to the entire horn face. However, the descrepency will be small as long as the number of boundary nodes is small compared to the total number of face nodes.
- For an axisymmetric FEA model, the entire face is not available. Instead, the amplitudes are only available along a single radial line across the face. In order to evaluate the uniformity, the circumferential area associated with each node must be calculated as:
A10) Ai = 2π ri wi where:
wi = width of element at node i The wi can be calculated as:
A11) wi = (ri+1 – ri)/2 + (ri – ri-1)/2 A11) wi = (ri+1 – ri-1)/2 where:
ri+1, ri-1 = radii of nodes adjacent to node i Special consideration must be given to the centerline node and the node at the periphery of the face.
Equation A10 may best be calculated by exporting the axisymmetric amplitudes to external software (e.g., a spreadsheet) and performing the calculations there.
Thus, although equation A7 is conceptionally better than equation 1, it may not be realistically practical due to the above problems.
Other possibilities
The uniformity might be calculated by comparing each local power intensity to the average power intensity over the horn face. Designating this uniformity as Ŵ´´:
| A12) Ŵ´´ | = | 1 – | 1/(n–1) | ∑ | Ui | – | Ū | ² | ||||
| Umax | Umax |
The quantity in the inner brackets is just the deviation of the local power intensity from the average power intensity. The quantity in the outer brackets is the average of all of the local deviations, where n is the number of local areas. (In statistics this is the variance which is the square of the standard deviation.) The least average deviation will occur when every local amplitude Ui is just equal to the average horn amplitude Ū; then the uniformity will be exactly 1.0, as desired.
Unfortunately, this definition suffers from the same problems as discussed above.
