Piezoelectric transducer design (preliminary)
Contents
- Overview
- Notation
- Langevin transducer
- Prestress designs
- Components
- Mechanical fits
- Assembly
- Transducer failure modes
- Testing prototype designs
- Performance
- Overcoming power limitations
- Appendices
- Appendix A: Comparison of 33 and 31 piezoceramic operation
- Appendix B: Manufacturer's piezoelectric cross-reference
- Appendix C: Method for applying prestress
- Appendix D: Piezoceramic dimensional specifications
- Appendix E: Piezoceramic electromechanical specifications
- Appendix F: Mechanical fits
- Appendix G: Understanding piezoelectric constants
- Appendix H: Effect of stack bolt on electromechanical coupling coefficient
- Appendix I: Resonance packet (pair)
- Appendix J: Comparison — series resonance and parallel resonance
- Figures
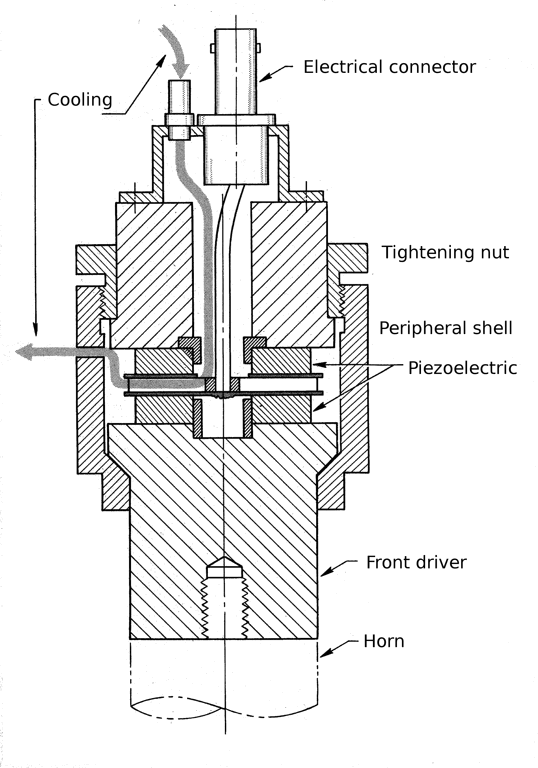
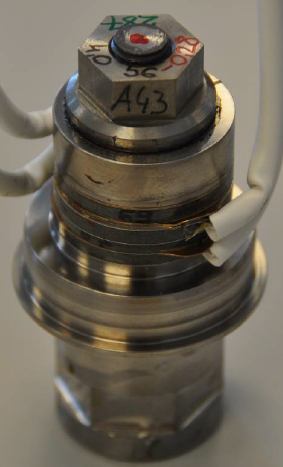
- Figure 1. 20 kHz industrial transducer with six piezoceramics (33 mode)
- Figure 2. Piezoelectric transducer components (center bolt design, 33 mode)
- Figure 3. Transducer performance (from FEA)
- Figure 4. Peripheral shell design
- Figure 5. 20 kHz transducer test for prestress
- Figure 5a. Transducer design
- Figure 5b. Damping resistance Z and frequency fs versus prestress T0
- Figure 6. Impedance versus current for various stack prestress
- Figure 7. Impedance at 300 ma — optimized piezoceramic prestress
- Figure 7a. Effect of prestress and temperature on d33 for PZT4 piezoceramic
- Figure 8. Pressure distribution across transducer piezoceramics at back-driver/piezoceramic interface
- Figure 9. Transducer design for improved prestress uniformity
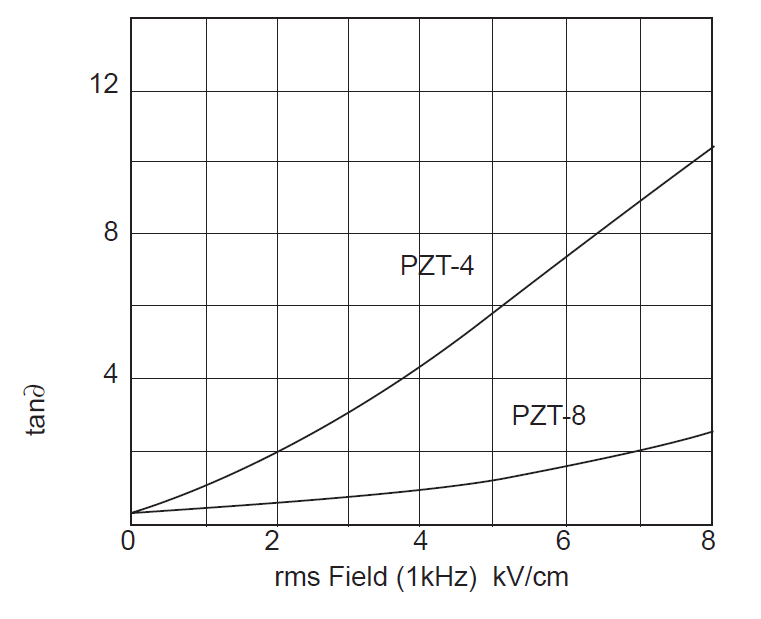
- Figure 10. Effect of electric field strength on piezoceramic \( tan\delta \)
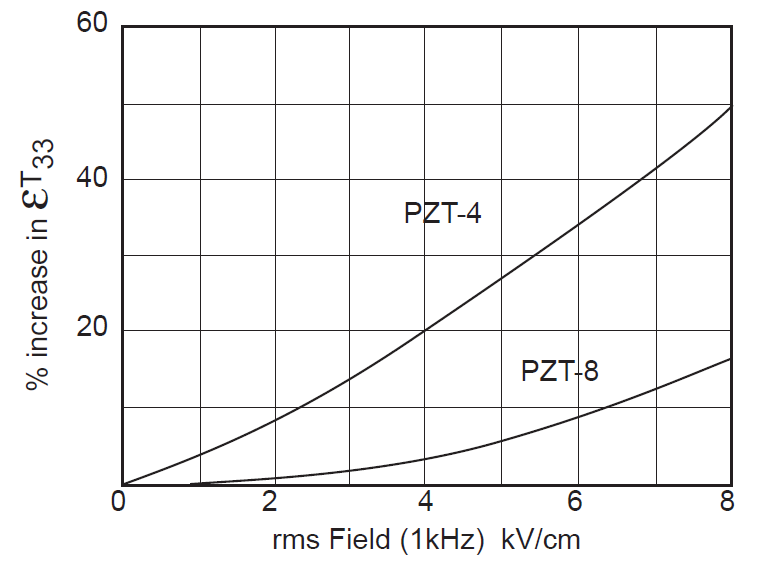
- Figure 11. Effect of electric field strength on piezoceramic permittivity
- Figure 12. Effect of static stress on \( d_{33} \)
- Figure 13. Transducer with (a) centered piezoceramic, (b) moderate piezoceramic offset, (c) high piezoceramic offset
- Figure 14. Effect of piezoceramic offset on transducer amplitude
- Figure 15. Effect of piezoceramic length and placement on \( \kappa_{eff}^2 \)
- Figure 16. Effect of piezoceramic length and placement on \( Q_{eff} \, * \, \kappa_{eff}^2 \)
- Figure 17. Arrangement to measure piezoceramic voltages
- Figure 18. Effect of piezoceramic location on piezoceramic voltage
- Figure 19. 120 kHz transducer — cross section in vicinity of piezoceramics
- Figure 20. Electrode with tangential wire
- Figure 21. Transducer with extended electrode disks
- Figure 22. Serpentine electrodes
- Figure 23. 55 kHz transducer — 6 piezoceramics, 2 serpentine electrodes
- Figure 24. Panel of photochemical etched electrodes
- Figure 25. —
- Figure 26. Cleaning transducer with conical back driver
- Figure 27. 20 kHz transducer with front driver wrench flats
- Figure 28. Effect of stack bolt on electromechanical coupling coefficient \( \kappa \)
- Figure 29. Transducer with Belleville springs and radial cooling fins
- Figure 30. Curing of Conap piezoceramic insulation
- Figure 31. Effect of stress and temperature on \( \kappa \) and \( d_{33} \) for PZT-4 piezoceramic
- Figure 32. 30 kHz transducer with arcing
- Figure 33. Metal welder prototype
- Figure 34. 30 kHz transducer with shifted piezoceramics
- Figure 35. 30 kHz transducer with cracked piezoceramics
- Figure 36. 15 kHz transducer power loading tests
- Figure 37. 15 kHz transducer power loading tests
- Figure 38. Arrangement for transducer electrical loading
- Figure 39. Effect of Curie temperature \( T_c \) on \( d_{33} \) for various piezoceramic compositions
- Figure 39a. Effect of operating frequency on transducer power
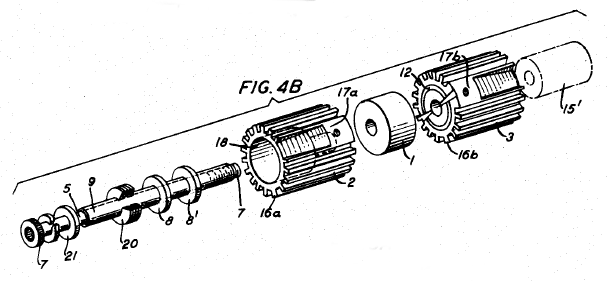
- Figure 40. Full-wave transducer (Williams patent 3,689,783)
- Figure 41. Kulicke & Soffa 80 kHz high power ribbon transducer
- Figure 42. Clustered transducers (two parallel stacks)
- Figure 43. Clustered transducers — two splayed stacks (Jones patent 3,148,293)
- Figure 44. Two stacks driving a single horn (Herrmann Ultrasonics)
- Figure 45. Bar horns with interlocking "ears" (Goldman patent 4,146,416)
- Figure 46. Dual facing transducers (Roberts patent 6,078,125)
- Figure 47. Dual facing transducers with anti-polarity piezoceramics (Roberts patent 6,078,125)
- Figure 48. Dual facing transducers — prior art (Jones patent 3,039,333)
- Figure 49. Dual facing transducer system for rotary ultrasonic additive manufacturing (UAM)
- Figure 50. Radial transducer array
- Figure 51. Compensating circuit for multiple stacks driving a single horn (Roberts patent 5,828,156)
- Figure 52. 20 kHz transducer with rear inlet and exhaust cooling ports
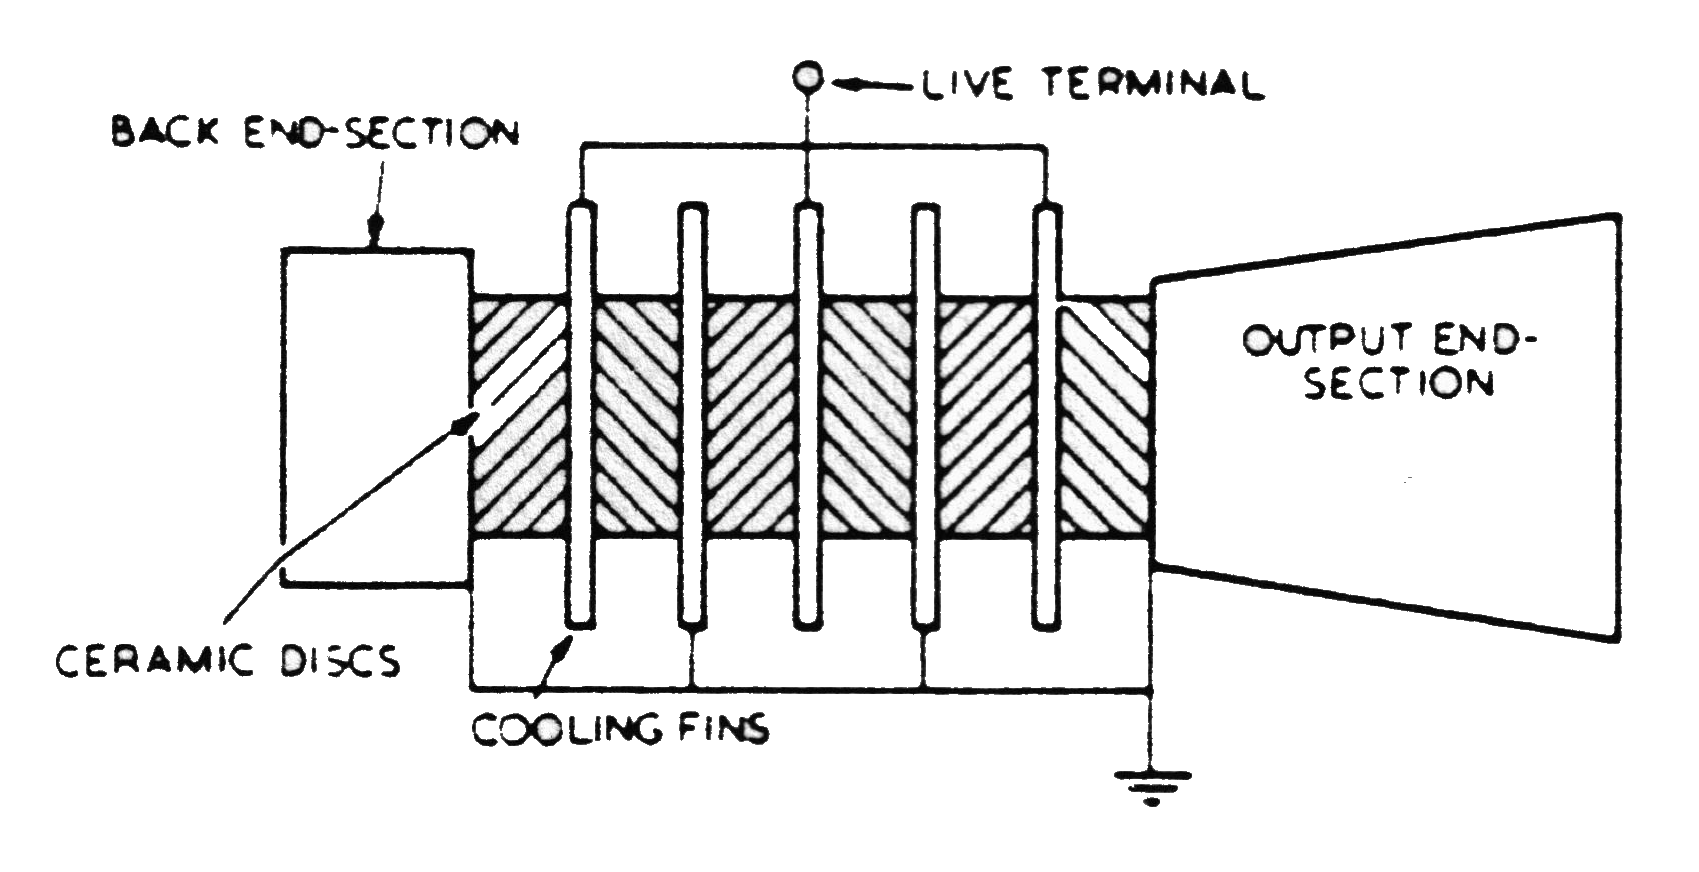
- Figure 53. Half-wave transducer with radially finned cooling cylinders
- Figure 54. Full-wave transducer with intermediate radially finned cooling cylinder
- Figure 55. 20kHz full-wave water-cooled booster
- Tables
- Table 1. Piezoceramic prestress (suggested or actually used)
- Table 2. Nominal piezoceramic properties at low electric field conditions
- Table 3. Electrode materials
- Table 4. Back driver materials
- Table 5. Front driver materials
- Table 6. Effect of stack bolt parameters on electromechanical coupling coefficient
- Table 7. Effect of soft metal shims on transducer performance
- Table 8. Maximum recommended piezoceramic temperature
- Table 9. Transducer amplitudes for industrial applications
- Table 10. Estimate of maximum transducer power
Overview
Ultrasonic transducers transform electrical output from the power supply into vibrational output. This electormechanical transformation may be accomplished by piezoceramics (below) or magnetostrictive materials (discussed elsewhere).
Transducer requirements will depend on the application. Many requirements will conflict with one another and will be given different priorities. Hence, no single set of guidelines can encompass all requirements — i.e., there are many different ways to achieve the same objectives.
Analytically, transducer performance can only be predicted in a general way. This is because the properties of piezoceramics are often highly dependent on the operating conditions including temperature, electrical field strength, static compressive prestress, dynamic stress, number of load cycles, and time. These operating conditions can interact with each other and the effects of these conditions are often nonlinear. Also, many properties of piezoceramics are orthotropic and can vary among the individual piezoceramics and also between piezoceramic lots. Further, the interactions at the various component interfaces (e.g., at threads) may be difficult to characterize and the coefficient of convective heat transfer for air cooling may only be approximately estimated. Hence, much of the design process involves experimental testing.
(Note: see Mathieson[1] for a fairly extensive list of references.)
Notation
In order to induce piezoelectric properties, an acceptable ceramic must be polarized by applying a high intensity electric field. The direction of the applied polarization field (i.e., the poling direction) has historically been designated as "3". Other directions are referenced from "3". For example, the "1" direction is transverse (perpendicular) to the "3" direction.
Piezoelectric parameters are often subscripted or described by two digits. The first subscript gives the direction of the applied electric field or the charge produced. (For power transducers, the applied electric field or the charge produced are typically in the "3" direction but this isn't a requirement.) The second subscript gives the direction of the mechanical stress or strain. For example, \( X_{31} \) indicates that the (ficticious) parameter \( X \) has an electric field that is parallel to the piezoceramic's polarization (in the "3" direction) and a resulting stress or strain that is transverse to the piezoceramic's polarization (in the "1" direction).
This notation will be used in the next section and elsewhere. (Notation that is associated with electrical and mechanical boundary conditions is discussed in Appendix G: Understanding piezoelectric constants.)
Langevin transducer
Almost all piezoelectric transducers for power ultrasonics are of the Langevin type — i.e., one or more piezoceramics that are mechanically compressed (prestressed) between a front driver and a back driver.
The piezoceramics are typically constructed to operate in one of two modes — 33 or 31. See details.
33 mode
In the 33 mode the piezoceramic expands parallel to the applied electric field. The piezoceramics are disk shaped and pairs of piezoceramics are used (usually no more than three pair). This mode is most common (figures 1 and 2) and will be discussed below.
|
|
|
|
|
|
|
||||||||||
|
31 mode
In the 31 mode the piezoceramic expands perpendicular to the applied electric field. The piezoceramic is typically a tube with electrode plating on the inside and outside diameters. Only a single piezoceramic is typically needed.
Prestressed designs
Because piezoceramics are weak in tension, a static compressive prestress must be applied to prevent the piezoceramics from ever experiencing tensile stresses when the transducer vibrates ultrasonically. In addition, the prestress assures that the piezoceramic interfaces make good contact so that the acoustic waves transmitt well with minimum loss. (Interface adhesives may help with this latter goal.)
There are several arrangements for applying the prestress. The desired characteristics of the member that applies the prestress are discussed here. (In the literature, prestress may also be called preload or bias load.)
Center stack bolt
The center bolt design is the simplest, cheapest, and most common. This design is shown in figures 1, 2, and 3.
Waanders (p. 49) recommends titanium for the stack bolt because of its high fatigue strength and low loss. However, steel bolts are most commonly used because they are readily available and relatively inexpensive. In addition, their fatigue stength easily exceeds that of titanium.
Stack stud with nut
This design is similar to the stack bolt but a stud is used instead. After the stud has been secured to the front driver, a nut is screwed onto the protruding section of the stud. The nut is then tightened against the back driver. (For example, see figure 9 for a 30 kHz design by Herrmann Ultrasonics[1].)
This design is superior to the stack bolt in two respects —
- Whereas the stack bolt is a single material, the material for the stack stud and nut can be separately optimized. For example, the stud could be titanium (low stiffness for better electromechanical coupling) and the nut could be steel (high stiffness for more uniform piezoceramic prestress).
- The nut can be designed with a very large diameter. Then the face of the nut is relieved (recessed) except for a relatively small ring near the periphery. When this ring presses against the back driver, the resulting compressive prestress is more uniform than can be achieved by using a bolt with a relatively small contact diameter.
Integral stack stud
In some cases the stack stud may not be a separate component but, instead, is machined as an integral part of the front driver. This is common in medical transducers where fluid must flow through a central bore. This eliminates any possibe fluid leakage where the stack bolt would normally be threaded into the front driver and any chance that fluid contaminates might accummulate in this area. The disadvantage is that a large amount of front driver material must be machined away in order to create the integral stack stud. In addition, this is not suitable for an aluminum front driver since the resulting aluminum stack stud would not be strong enough to appply the required prestress to the piezoceramics.
Peripheral shell
A peripheral shell is a cylinder that encloses the piezoceramics. For example, see Wave Energy Systems' transducer (figure 4).
|
|
|
In addition to prestressing the piezoceramics the shell can also serve as the transducer housing. Compared to the center bolt design, the peripheral shell has several advantages.
- Increased power —
- The piezoceramic volume can be larger because the piezoceramics don't need a central bore to accommodate the stack bolt. (Although the design of figure 4 shows a central bore, this is not necessary if the electrode leads are extracted elsewhere — e.g., through the shell.)
- However, if the central bore is eliminated then the electrode leads must pass through the shell or some other external passageway.
- Because there is no need for a nodal flange on the front driver to mount the housing, the piezoceramics can be centered at the transducer's node rather than being offset behind the nodal flange. This gives the highest electromechanical coupling between the electrical energy input and the vibrational output. Thus, the power can be twice that of a design where the piezoceramics are offset. See Power.
- The prestress across the piezoceramics may be more uniform. Thus, the highest (peak) prestress at any location in the piezoceramics will be lower. This increases the allowed operating temperature.
- Better resistance to flexure. With common center bolt designs the static prestress may be less than desired toward the piezoceramic periphery. Such designs may therefore be susceptible to piezoceramic damage due to flexure. By applying more uniform prestress the peripheral shell may reduce this problem.
- Better water tightness. Common center bolt designs support the housing with O‑rings at the nodal flange. These O‑rings are designed to isolate, rather than seal, the housing. If the nodal flange is not located at precisely the node then the flange will vibrate, thereby possibly allowing leakage. Since the peripheral shell design does not mount at a nodal flange, it can be more water tight. (Note: some center bolt designs use a rigid mount rather than O‑rings at the nodal flange. Then the peripheral shell would not have a leakage advantage.)
- Better fatigue resistance. Since there is no stack bolt to be threaded into the front driver, there is no chance of front driver fatigue at that location. This might allow a material with lower fatigue strength. For example, magnesium might replace aluminum; since magnesium has significantly lower density (1740 kg/m3 versus 2810 kg/m3) the transducer's output amplitude would be correspondingly increased. Note, however, that the output threads where the stud is inserted might be unacceptably weak. (See further discussion.) Also, pure magnesium is highly flamable so care must be taken during machining. (Wave Energy Systems' design of figure 4 used a magnesium front driver. The reliability of this design is not known.)
The peripheral shell has several disadvantages compared to the center bolt design.
- Expensive. The shell and associated nut are expensive compared to an off-the-shelf stack bolt.
- Assembly difficulties —
- Maintaining piezoceramic concentricity.
- Extracting the electrode leads. This may be difficult when there are more than two piezoceramics. However, this would be easier with serpentine electrodes.
- Active shell --> bad for hand held. Shell wall must be thin for max compliance. Painting of piezoceramic ID if use interior cooling air.
For further information see Jones patent 3,283,182.
Peripheral stack bolts
This design is similar to the peripheral shell except that peripheral shell is replaced by a series of peripheral bolts. Like the peripheral shell, this design may provide more uniform prestress across the piezoceramics. However, the stack bolts must be tightened in a gradual criss-cross manner. If not done carefully this can lead to nonuniform piezoceramic prestress. In addition, the gradual tightening process means that the voltage across the tightening capacitor can bleed off, thereby giving an incorrect prestress reading. (See elsewhere.) Also, the peripheral bolts may introduce spurious resonances (Jones, p. 2) and may be slightly less efficient than center bolt/stud designs (APC International). Hence, this design is seldom used.
Determining the required prestress
The compressive prestress must be sufficient to prevent the piezoceramics from ever experiencing any ultrasonic tensile stress and to prevent any lateral piezoceramic slippage. The required prestress is not well defined.
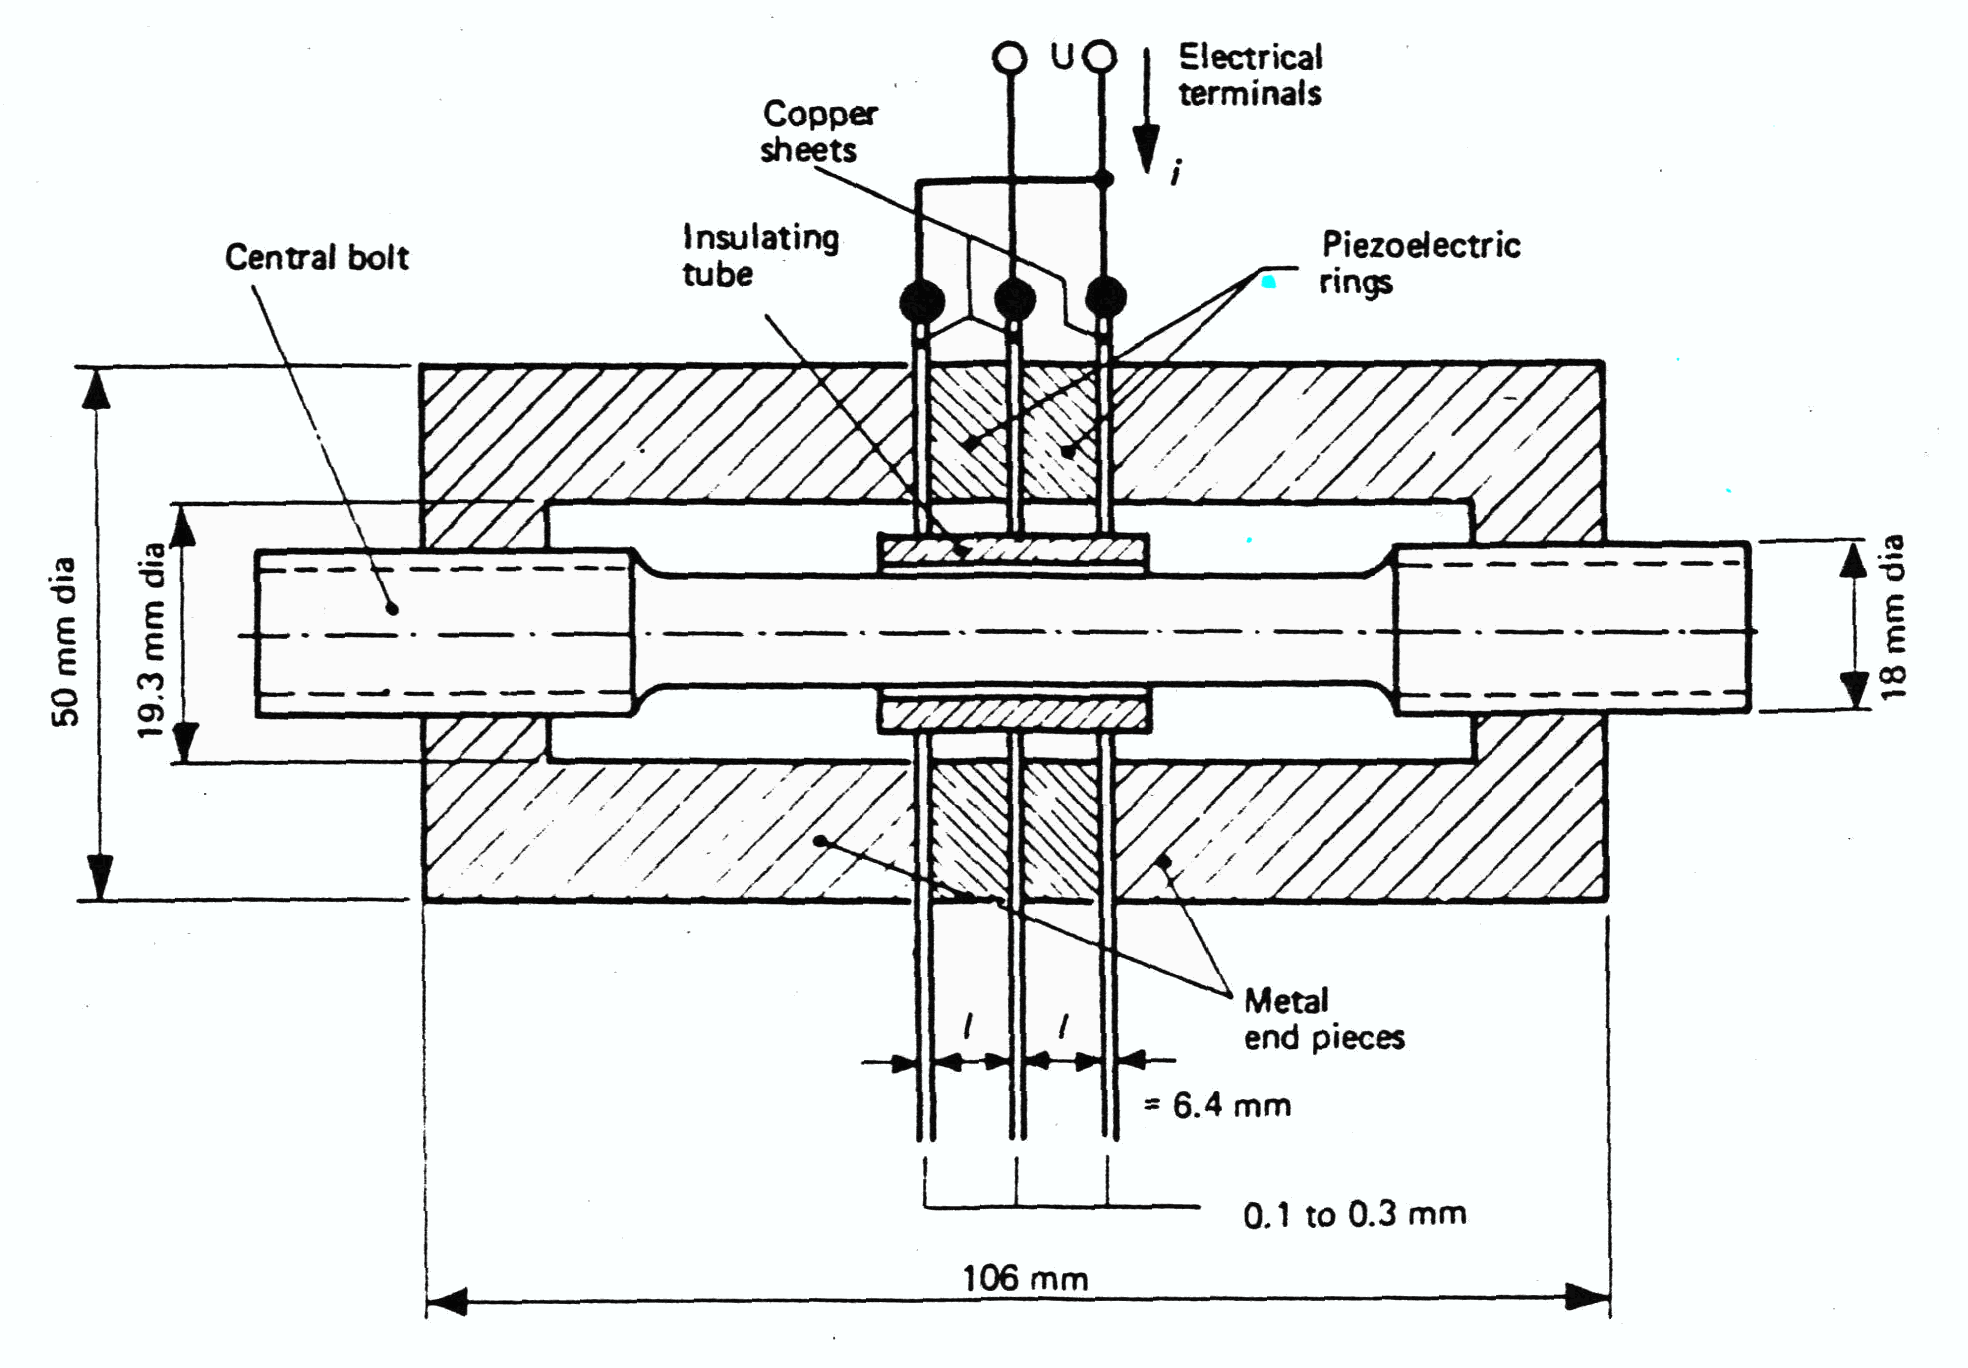
Hulst[1] investigated prestress for the transducer shown in figure 5a. The electrodes were "very soft annealed copper" which helped to improve mechanical contact between parts and reduce mechanical damping in the contact zones (p. 285).
Figure 5b shows the change in damping resistance and resonant frequency with prestress for PZT4 piezoceramics. Hulst (p. 286) notes that the frequency has stabilized at about 35 MPa but even higher prestress is required to stabilize the damping resistance (~50 MPa from figure 5b). (Hulst states that the results were determined experimentally but the specifics are not given; in particular, it is not known if these results are from low-drive or high-drive tests.)
|
||||||||||
|
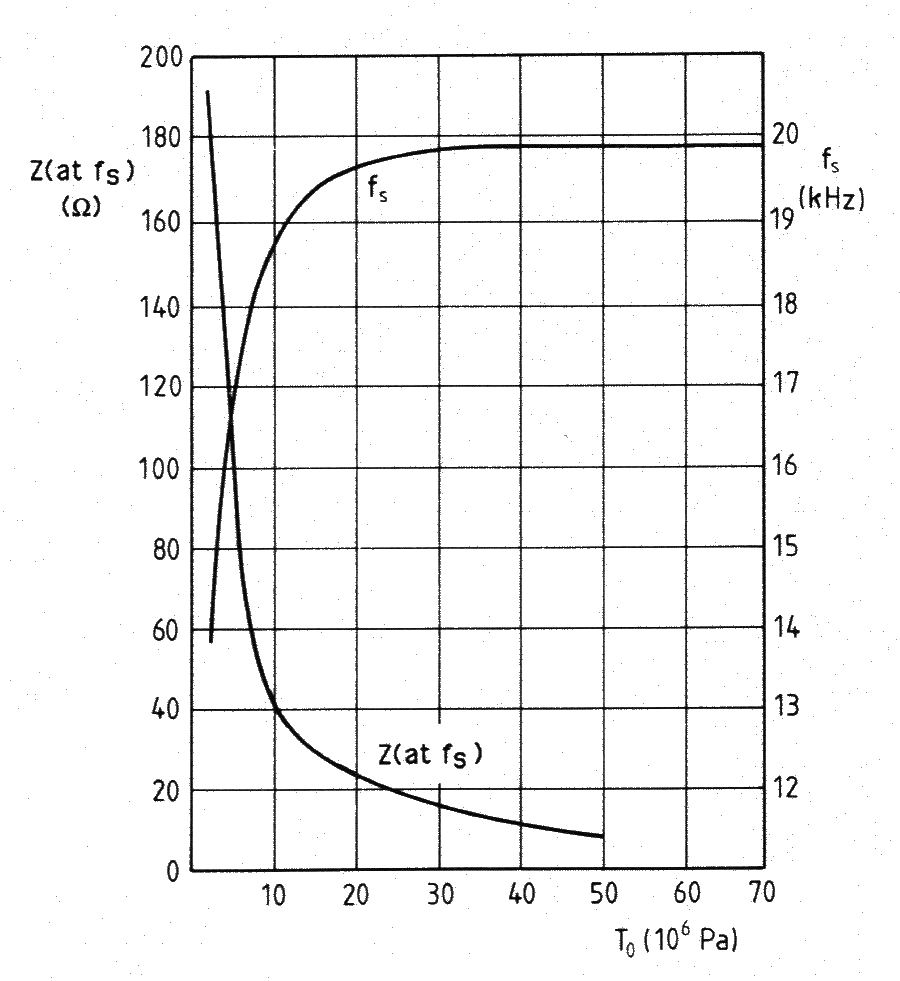
Since the resistance and frequency seem to stabilize with increasing prestress, one might be tempted to just apply a very large prestress. Unfortunately, piezoceramic performance generally degrades as the prestress increases.
- "The dynamic \( d_{33} \) constant may decrease by about 30% if a prestress of 35 N/mm2 [35 MPa] is applied to a stack of two disks. ... a similar behaviour is expected and found for g33." (Hulst[1], p. 290)
- "The properties of the piezoceramic are modified under compression-bias. In particular, the maximum safe temperature at which the material will function efficiently may be drastically reduced." (Neppiras[1C], p. 301) (This suggests that a high compressive stress may reduce the Curie temperature although specific confirmation has not been found.)
- "Excessive preload results in pronounced depoling, with unstable impedance and aging in operation." (DeAngelis[1], p. 1)
- "Compressive stresses may not exceed a specific limit as they could lead to mechanical depolarization, and strain mustn’t exceed a specific limit; otherwise, the mechanical losses of the piezoceramic will increase drastically, leading to heat-up and resulting in failure." (Lierke[1], p. 935)
Thus, a compromise intermediate prestress must be specified. This must be determined by actual tests of the particular transducer design.
For example, DeAngelis[1] describes tests by which the optimum prestress was determined for 120 kHz wire bonding transducers. The tests were conducted on five transducers, each of which had a different prestress. All of the PZT8 piezoceramics were from the same production lot (aged for two years) and were verified for consistent performance prior to assembly. After assembly the piezoceramics were stabilized by heat treatment and cycling.
(Note: DeAngelis' tests used multiple transducers, one for each prestress level. However, for a center-bolt design a rough estimate of the effect of prestress might be determined with a single transducer by tightening the bolt in steps. However, this is not desirable because —
- The single stack of piezoceramics may not be statistically representative.
- Once a given prestress has been applied, the effect of any previous piezoceramic stabilization will be disturbed. Then the next prestress level will be affected by this disturbed stabilization. Attempts at re-stabilization will just confound the situation since the piezoceramics will not necessarily return to their previous stabilized performance.
In addition, the tests should be performed at high drive levels as the transducer will actually be used.)
The tests of the assembled transducer included amplitude (via laser vibrometer), frequency, and impedance measurements. Impedance measurements (figure 6) seem to give the best discrimination among the various prestress levels. The X axis current correlates to the drive level (i.e., higher current indicates higher drive).
(Although DeAngelis does not specifically state the resonance condition, the article seems to indicate that these transducers were operated at short circuit resonance for which a low impedance is desirable.)
|
|
|
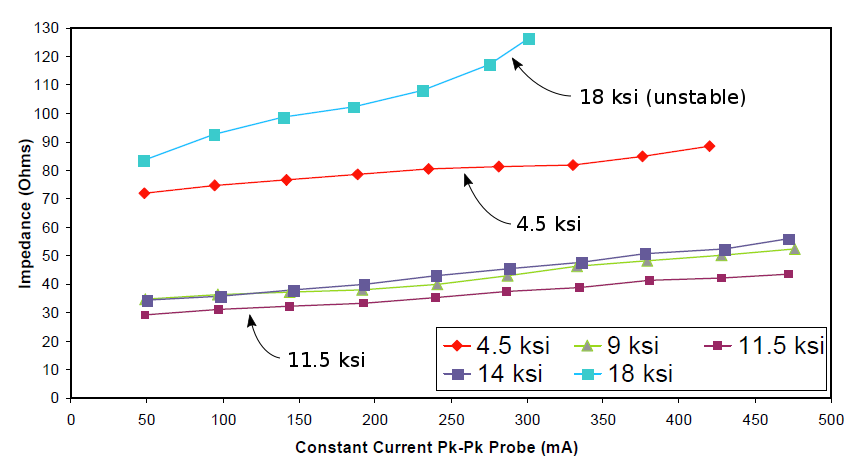
The 4.5 ksi (31 MPa) prestress has high impedance because the piezoceramics are not adequately clamped whereas the 18 ksi (124 MPa) prestress has high impedance because the piezoceramic performance degrades under excessive prestress.
Figure 7 shows the above data at 300 ma (i.e., the highest current for which the 18 ksi data are available). For this particular transducer design a prestress between 9 kpsi (62 MPa) and 14 ksi (97 MPa) gives acceptably low impedance. In case the following may occur, an intermediate prestress within the acceptable range should be chosen in order to provide a factor of safety.
However, not all transducer designs may be this forgiving.
- Flexure or shock waves. An unbalanced horn (e.g., horns with face contours or bent probes) may send flexure waves back through the piezoceramics. Similarly, certain applications such as inserting may send shock waves back through the piezoceramics. Such waves may cause the piezoceramics to shift. The magnitude of these waves may not be predictable in advance. For example, a standardized transducer may be used with various boosters and various contoured horns whose degree of unbalance may not be known in advance.
- Thermal expansion. may reduce prestress. bolt vs piezoceramics zzz
- Seating of piezoceramics and components.
|
|
|
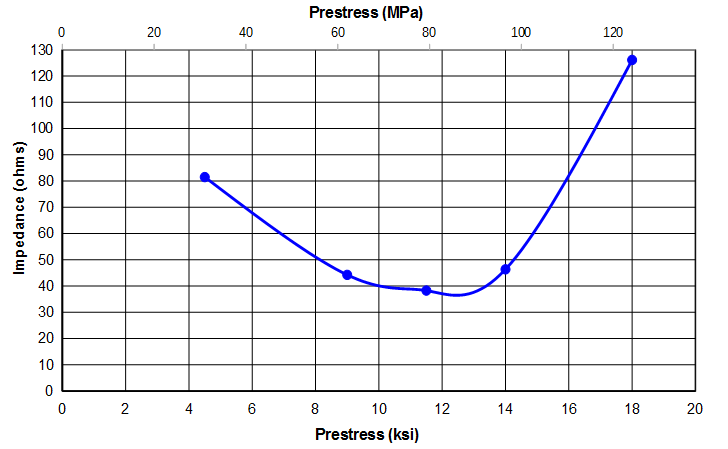
Figure 7a (see notes) shows how the piezoceramic \( d_{33} \) is affected by prestress and temperature. At room temperature the \( d_{33} \) shows little effect from either prestress or temperature. However, many power transducers operate at elevated temperatures. At these elevated temperatures figure 7a shows that the \( d_{33} \) can decrease significantly; this decrease becomes more severe with increasing prestress. Hence, the prestress should be the minimum that will assure that the ceramics don't fracture under dynamic loading (after applying a reasonable factor of safety).
Figure 7a notes —
- Figure 7a is from Bromfield patent 2007/0063618 A1 which cites Krueger 1961 as the source. However, the Krueger 1961 source could not be found. In figure 7a the units for the temperatures are assumed to be Celcius since Kureger uses Celcius in other publications. See the references.
- In contrast to figure 7a, figure 12 which shows that \( d_{33} \) increases with static stress. See the discussion there.
|
|
|
The following prestress have been suggested or used; the assumed factors of safety are not known. Note the very large range of values.
|
||||||||||||||||||||||||||||||||||||||||||||||||||||||
|
Table notes —
- The lower values of prestress are likely for "well behaved" systems (e.g., transducers with relatively uniform prestress across the piezoceramics and without flexure waves that may cause piezoceramic slippage or cracking) where a low factor of safety is acceptable. Hulst's design, where the loaded threads are far from the piezoceramics, should have fairly uniform piezoceramic prestress.
- "For PZT4 the maximum compressive stress should not exceed 15,000 psi [103 MPa] for static operation and 7,000 psi [48 MPa] for sustained cyclic operation." Channel Industries[1] (p. 4)
Prestress pressure uniformity
Prestress pressure uniformity over a specified piezoceramic surface is defined as —
\begin{align} \label{eq:10098a} \textsf{Prestress uniformity} = \frac {\textsf{Lowest compressive stress}}{\textsf{Highest compressive stress}}\end{align}
With a center stack bolt, the highest compressive stress typically occurs at the piezoceramic inside diameter while the lowest compressive stress typically occurs at the piezoceramic outside diameter. As the piezoceramic diameter increases in relation to its half-wavelength at the specified frequency, the stack bolt becomes less effective in applying a uniform prestress across the piezoceramic. Then the average prestress must be increased in order to maintain a certain minimum prestress at the piezoceramic outside diameter. However, this results in excessive at the piezoceramic inside diameter which can be detrimental to performance.
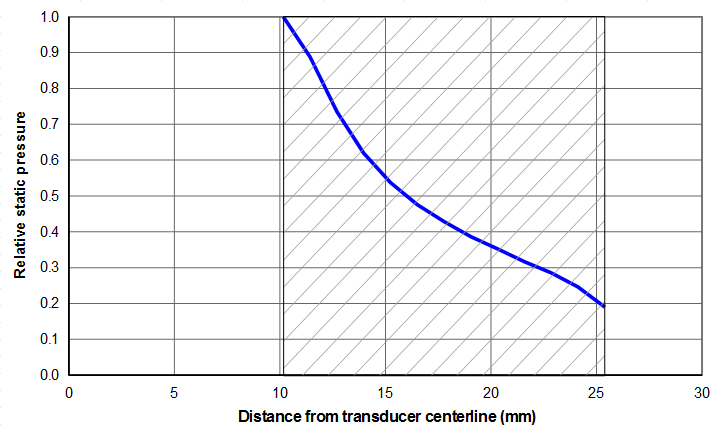
Figure 8 from Culp shows this effect for the transducer of figures 1 and 2. The piezoceramic in this transducer has an outside diameter of 50.8 mm and an inside diameter of 20.3 mm. These dimensions are shown by the hatch in figure 8. The stack bolt is 1/2‑20 with a head diameter of 19 mm.
Figure 8 shows that the prestress uniformity is only 0.19 or 19%. When used with horns having some unbalance, this transducer was generally less stable than a similar design having piezoceramics with an outside diameter of 40.6 mm, possibly because the latter had substantially better prestress uniformity. (Note — the instability was exhibited as significantly higher temperatures in the piezoceramics and higher (unacceptable) loss compared to when running with a balanced horn.)
|
|
|
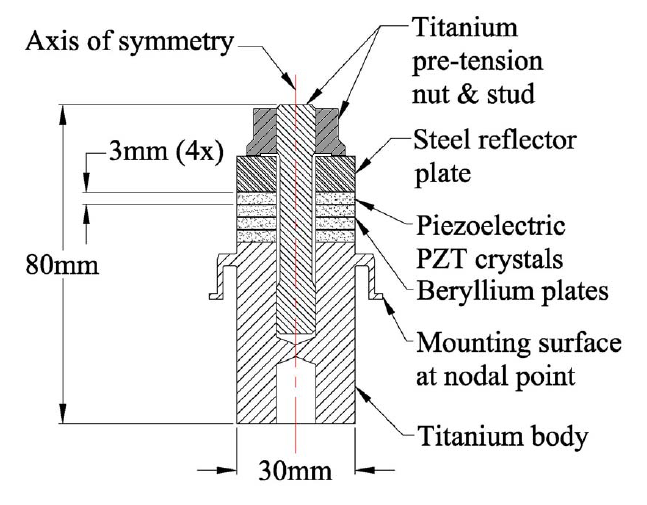
The prestress uniformity can be improved by increasing the bolt head diameter. The contact between the bolt head and the back driver is then limited to a small ring whose diameter is roughly the average of the piezoceramic's outside diameter and inside diameter. This method is shown in figure 9 for a 30 kHz transducer (Herrmann Ultraschalltechnic) which uses a separate nut and stud instead of a bolt (Hampton[1], p. 10). (See Culp's 1991 disclosure.)
Note in figure 9 that the stud's thread engagement into the front driver is significantly far from the interface of the front driver and piezoceramic. This is achieved by reducing the shank diameter of the stud; this could also be achieved by counterboring the front driver in this area to remove the front driver's threads. By whichever method, the application of the stud force far from the piezoceramics results in further improvement in the prestress uniformity.
|
||||||||||
|
Factor of safety
The nominal prestress must be increased by a reasonable factor of safety in order to accommodate the following.
- Seating of the transducer components as the transducer is cycled. This may lead to reduced prestress.
- Different rates of thermal expansion among the transducer components (temperature rise due to normal power delivery, operation at high environmental temperature).
- Flexural waves due to resonator unbalance, off-axis loading, or interaction with secondary resonances. The nominal prestress is only designed to accommodate longitudinal vibration. If flexural waves are (or may be) present then additional prestress is needed to accommodate the associated flexural stresses.
- Shock (impact) loading. This may occur, for example, in inserting applictions.
- Nonuniform prestress pressure across the piezoceramic surface.
Applying the prestress
Thread & bolt head lubricants. Bolt unwinding. With stud can use hex wrench or similar to prevent the bolt from winding; otherwise, should account for winding when specify prestress.
Methods -- Torque; Piezoceramic voltage; Compression in hydraulic press (press alignment to apply uniform pressure to the piezoceramics)
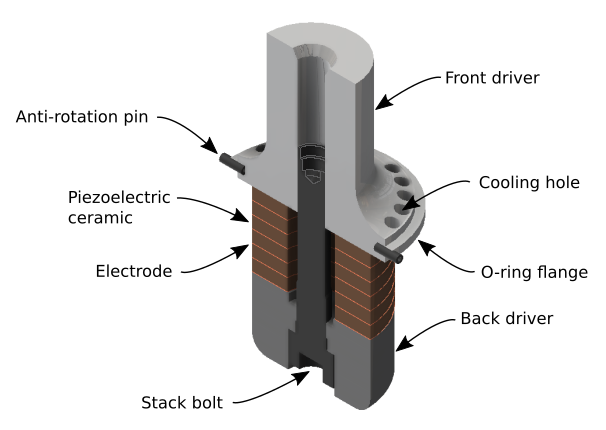
Components
Typical components of a Langevin transducer are shown in figure 2. These are discussed below.
Piezoceramics
Piezoceramics are the heart of the transducer.
Types
Piezoceramics are typically classified as "soft" or "hard". Hard piezoceramics are used for power applications. Among hard piezoceramics there are two basic types, generally designated as PZT4 and PZT8. (PZT stands for lead-zirconate-titanate of which the piezoceramics are composed.) Different manufacturers may have their own designations for these types but the general performance is similar. The following table compares PZT4 and PZT8 at low field conditions.
|
||||||||||||||||||||||||||||||
|
Table notes —
- Values are at room temperature and low drive. Properties may be significantly different for high tempertures and/or high drive and should, therefore, not necessarily be used for design. ("It should be noted that at high drive levels QE and Qm0 can no longer be treated as constants - they are then often much lower than the low drive-level values." Waanders, section 6.1.1, p. 42)
- \( Q_m \) is measured for a thin disk.
- \( K^T_{33} \) is the ratio of the permittivity of the free (unclamped) piezoceramic to the permittivity of space.
- Except for the dielectric loss, higher values give better performance.
- Also see Berlincourt[2].
PZT401 has a higher strain constant \( d_{33} \) which will give higher amplitude and a slightly higher electromechanical coupling coefficient \( \kappa_{33} \). However, "PZT8 is recommended for applications requiring higher power handling capability than is suitable for PZT4." (Berlincourt[2], p. 2) Also, PZT8 is often less affected by the operating conditions than PZT4; for example, see figures 10 and 11.
zzz Morgan Technical Publication TP-226 lists max static compressive stress for PZT4 as 83 MPa
zzz "max static compressive stress" is the stress at which depoling occurs?
ZZZ As noted above, the maximum static prestress must be reduced if the transducer will be used under sustained dynamic operation (typical for power transducers).
Effect of operating conditions
Piezoceramics are often significantly affected by operating conditions. (See Berlincourt[1] for a fairly extensive discussion.) The following figures show examples for the electrical field strength and static stress. Also see the section on determining the prestress.
|
|
|
|
|
|
|
|
|
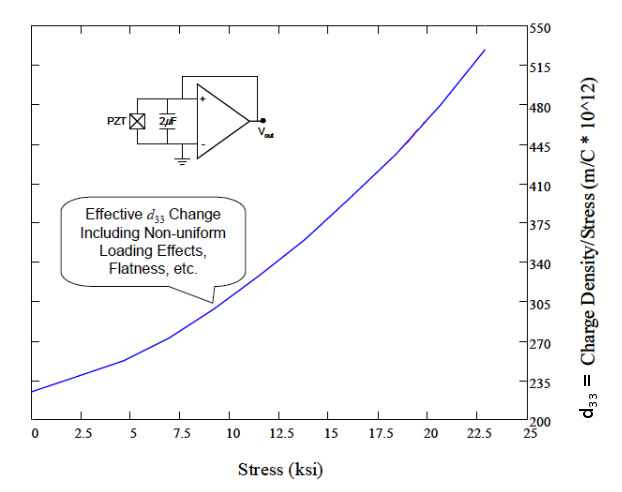
Figure notes —
- Figures 9 and 10 are from Berlincourt[2]. The data were determined at room temperature without biasing stress. (See Morgan Technical Publication TP-217.)
- In figure 10, \( tan\delta \) is a percent.
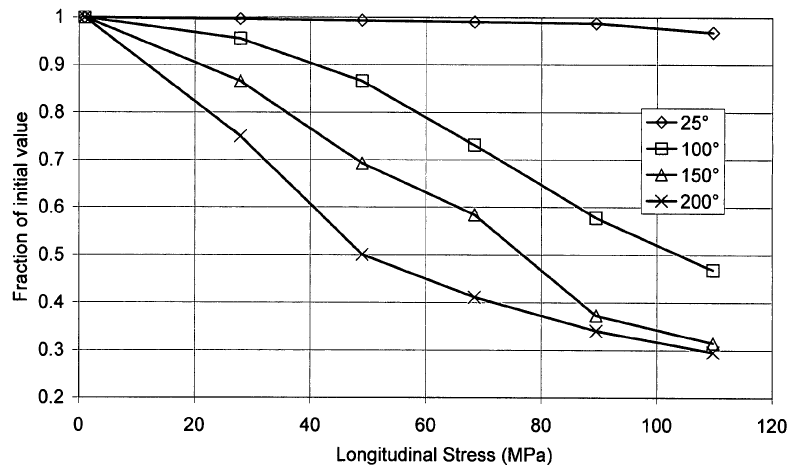
- Figure 12 is from DeAngelis[1] (figure 10, p. 2). The static stress was applied uniformly across the piezoceramics with a tensile tester. (Note — See figure 7a which shows little effect of static stress on \( d_{33} \) at room temperature. The reason for this discrepancy is not known although note that figure 12 includes the possible effects of "non-uniform loading, flatness, etc.".)
Placement
The piezoceramics are located between the back driver and front driver. Some minimum back driver stiffness is required in order to provide acceptable prestress across the piezoceramics; this stiffness depends on the back driver's length, material, diameter, and method by which the back driver is supported. The same considerations applies to the front driver.
In order to tune to the desired longitudinal resonance, the back driver and front driver lengths will often be longer than the minimum requirements. The question is, as the lengths of the back driver and/or front driver are adjusted, where should the piezoceramics be placed relative to the transducer's node? The piezoceramic placement should consider output amplitude, power delivery, loss, frequency stability, and mounting.
There are two basic placement possibilities: 1) the piezoceramic stack can be centered at the node or 2) the piezoceramic stack can be offset from the node.
Amplitude considerations
In theory, the transducer's amplitude will be maximized when the piezoceramics are located where the strain is highest (i.e., at the node); the amplitude will be reduced if the piezoceramics are moved away from the node. Mathieson's tests (figures 12 and 13) have verified this for a low drive level (one volt RMS).
|
|
|
|
|
|
(Note that as the piezoceramic offset increases the resonant frequency also increases. This is because the low-modulus piezoceramic material is effectively being replaced by higher-modulus front driver material (brass in this case), thereby stiffening the transducer.)
In order to maximize the output amplitude, the front driver's output diameter is often made smaller than the piezoceramic diameter. This is similar to building gain into boosters and horns. The amplitude will be maximized when the length of this reduced diameter is maximized. However, when the piezoceramics are centered the front driver length is shorter than with offset piezoceramics; this would reduce the amplitude somewhat compared to offset piezoceramics. Analysis would be needed to predict the net amplitude effect.
While centered piezoceramics give the highest amplitude at low drive levels, Mathieson shows that this may not be true at higher drive levels where nonlinear effects must be considered.
Power considerations
The approximate maximum power that a transducer can deliver is given by the following equation. (See the derivation and limitations.)
\begin{align} \label{eq:10070a} P &= 2 \pi f_s \, {E_3}^2 \, \varepsilon_{33}^T \, \kappa_{eff}^2 \, Q_M \, V \end{align}
where —
| \( P \) | = acoustic power delivered [W] |
| \( f_s \) | = series resonance frequency [Hz] |
| \( E_3 \) | = electric field strength [V/m] |
| \( \varepsilon_{33}^T \) | = piezoelectric permittivity at constant stress [(coulomb/volt)/m = Farad/m] |
| \( \kappa_{eff} \) | = electromechanical coupling factor [no units] |
| \( Q_M \) | = mechanical Q [no units] |
| \( V \) | = total piezoceramic volume [m3] |
With all other things being equal, the power will be maximized when the electromechanical coupling factor, the mechanical Q, and the total piezoceramic volume are maximized.
The effective electromechanical coupling coefficient \( \kappa_{eff} \) depends on the location of the piezoceramic relative to the node and on the piezoceramic volume. Figure 12 from Lierke[1] shows these effects.
|
|
|
where —
| \( L_{piezo} \) | = length of piezoceramic |
| \( L_{total} \) | = total transducer length |
| \( \kappa_{eff}^2 \) | = square of effective electromechanical coupling coefficient [no units] |
| max(\( \kappa_{eff}^2 \)) | = maximum possible \( \kappa_{eff}^2 \) for any of the considered transducer configurations [no units] |
As indicated in figure 15 —
\begin{align} \label{eq:10071a} \kappa_{eff}^2 &= \frac{{f_a}^2 - {f_r}^2}{{f_r}^2} \end{align}
where —
| \( f_a \) | = antiresonant frequency |
| \( f_r \) | = resonant frequency |
Notes —
- The piezoceramics are the gray area on each transducer sketch.
- The end masses (unshaded area) are the passive material — i.e., the same material as the piezoceramics except unpoled (no available piezoelectric effect).
- The transducer's cross-section is constant along its length.
- \( f_a \) and \( f_r \) can be fairly easily determined by FEA or the wave equation if the corresponding open circuit and short circuit moduli are specified.
Two conclusions can be drawn from figure 15 —
- Regardless of the piezoceramic placement, \( \kappa_{eff}^2 \) is maximized when the piezoceramic length is \( 1/2 \) of the transducer length (i.e., \( L_{piezo} / L_{total} \, = \, 0.5\)).
- For any given \( L_{piezo} / L_{total} \), \( \kappa_{eff}^2 \) is maximized when the piezoceramic is centered at the node (solid upper curve) where it experiences the maximum strain rather than being offset from the node (two lower curves) — the greater the offset the lower the \( \kappa_{eff}^2 \).
Lierke also considerd the combined effect of \( \kappa_{eff} \) and \( Q_M \) (figure 15x). As when considering \( \kappa_{eff}^2 \) alone, the optimum placement for the piezoceramics is again at the node (the upper curve). However, the optimum piezoceramic length is reduced from 0.5 to 0.33 (corresponding to the peak of the upper curve). In addition, note that the upper curve has relatively low curvature over a broad range. For example, the curve lies above 0.9 for \( L_{piezo}/L_{total} \) between 0.2 and 0.5. This means that the piezoceramic length is reasonably "near optimum" as long as it is greater than \( 0.2 \, * \, L_{total} \).
Assuming a wave speed in the piezoceramic of approximately 3200 m/sec (Waanders, p. 42), then \( L_{total} \) at 20 kHz would be 80 mm. Then the optimum piezoceramic length would be 0.33 * 80 mm = 26 mm and the "near optimum" length could range between 16 mm and 40 mm. (The 20 kHz transducer of figure 1 has six piezoceramics, each 5 mm thick, so the resulting \( L_{total} \) is 30 mm which is close to Lierke's predicted optimum.)
|
|
|
Although Lierke's analysis did not consider the effect of a load, he notes, "Almost the same behavior applies if the transducer acts against medium and strong loads, such as radiating into water or plastics welding." (p. 936)
Locating the piezoceramics away from the node (in an area of reduced strain) reduces the vibrational loss in the piezoceramics. However, this location may substantially reduce the available power (up to one–half per Wuchinich[0]) due to reduced electromechanical coupling. (Shoh patent 3,524,085 suggests that the optimum location should be 1/12 wavelength from the free end of the back driver. However, this location is somewhat extreme and is seldom used.)
Loss considerations
Centered piezoceramic placement has two disadvantages. First, for an axially vibrating unshaped resonator the mechanical loss will be highest at the node (i.e., since the mechanical loss depends on the strain which is highest at the node). (This generalization excludes special considerations such as thread losses.) Since the inherent mechanical loss of piezoelectric piezoceramic is typically much greater than the loss of acoustic metals, this suggests that the tranducer's mechanical losses can be reduced by moving the lossiest material (the piezoceramics) away from the node.
However, when numerous offset piezoceramics are used, as in figure 1 and figure 2, those piezoceramics that are farthest from the node naturally experience lower strain than those closest to the node. (This is an acoustic requirement since the strain must eventually drop to zero at the antinode free ends.) To accommodate the reduced strain that occurs away from the node, the driving voltage should similarly decrease progressively away from the node. However, for design convenience all of the piezoceramics are typically driven at the same voltage.
Culp[0] evaluated two test transducers like those of figures 1 and 2. In each case the test transducer was driven by a master transducer whose output amplitude was fixed. The induced voltage across each piezoceramic of the test transducer was measured in turn. Figure 17 shows the arrangement (after Hampton[1], p. 58).
|
|
|
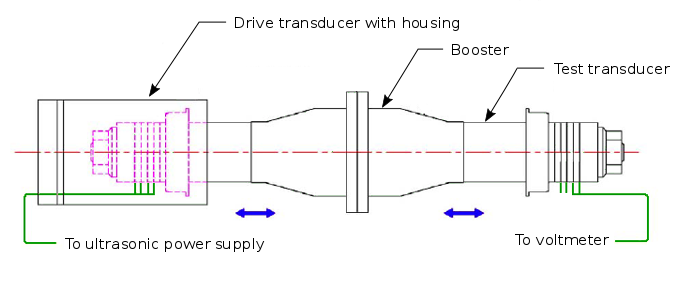
Figure 18 shows the resulting voltages. The dashed line is the measured voltage when all of the piezoceramic pairs are connected in parallel; this is how the transducer would normally be operated so this is designated as the "normal" voltage. It turns out that the dashed line is also the average of all of the individual voltages for a particular transducer.
|
|
|
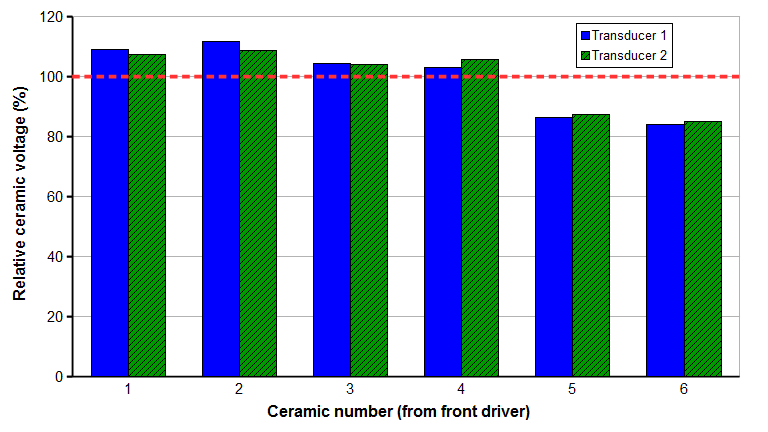
First, note from figure 3 that the node in the piezoceramics occurs approximately between the second and third piezoceramics from the front driver so this is the location of maximum piezoceramic strain. Comparing the highest and lowest voltages of figure 18, piezoceramic 2 is about 10% higher than the normal voltage whereas piezoceramic 6, which is farthest from the node, is about 10% lower than the normal voltage.
Notes —
- Both transducers were well aged (at least several years).
- No attempt was made to assure that every piezoceramic of a particular transducer had the same \( d_{33} \).
- Theoretically, the piezoceramic strain and induced voltage should decrease cosinusoidally from the node. The sudden voltage drop for piezoceramic 5 in both transducers is therefore interesting but currently unexplained.
As Roberts patent 6,434,244‑B1 (2002) notes for such offset piezoceramic designs, "This [offset] leads to unwanted circulating currents, electrical losses, and unequal power contriutions for each pair of piezoceramic wafers."
Thus, the optimum piezoceramic placement (in terms of loss) seems unclear.
Mounting considerations
Centered piezoceramics are most common where no housing is required (e.g., for transducers used in cleaning tanks or, in some cases, where the support structure (e.g., the plastic welding stand) can serve as the housing). If a housing is needed then the centered design typically has a mounting disk that is centered within the piezoceramic stack. This can cause several problems.
- The electrode leads from the forward piezoceramics must be routed through or around this plate in order to attach to the rear electrical connector.
- The housing should be designed to prevent accidental contact between people or external objects and the high voltage piezoceramics or electrodes. This housing design can be somewhat awkward.
- If the housing must resist any static forces then these forces are transferred to the mounting disk and then directly to the adjoining piezoceramics. This potentially can damage the piezoceramics. This is mainly a problem for housings that are rigidly mounted to the transducer (less so for housings that are mounted with Orings).
Offset piezoceramics circumvent these problems since all of the piezoceramics are located behind the node. Then a separate mounting disk is not needed since the housing is attached in some manner directly to the front driver.
Mathieson[2] shows that piezoceramic placement can be used to suppress some unwanted transducer bending and torsional modes. However, this will not be effective for general purpose transducers (i.e., transducers that can accept a variety of boosters and/or horns). This is because the frequencies of the bending and torsional modes will change depending on the particular stack components that are added to the transducer. Thus, this approach will only be effective for a dedicated transducer (i.e., one that will only be used with a single booster and/or horn design) .)
Individual piezoceramic thickness
The piezoceramic thickness can't be arbitrarily chosen. "Optimising the thickness of the piezoceramic used within the stack of a Langevin transducer can be important [because] the thinner the piezoceramic element is, the better the electric field uniformity, the higher the effective electromechanical coupling coefficient and lower its impedance (higher the fow of current and hence amplitude for a given driving voltage). However, reducing the thickness of the piezoceramic element, increases the number of elements within the defined stack length which in turn increases the cost of manufacturing the transducer as well as increasing the capacitive value. Increasing the number of piezoceramic elements in the stack can also lead to inefficiency due to mechanical losses (caused through increasing the number of join interfaces) and drive problems, as too many elements can induce phase shifts among the elements causing them to counteract one another's oscillations. On the other hand thicker piezoceramic elements reduce the complexity of the transducer, hence reducing manufacturing cost as well as the mechanical losses (reduction in the number of join interfaces). However, thicker elements will also lead to a less uniform electric field at a given voltage whilst also increasing the impedance and internal heating [182-184]. Therefore a trade off between using many thinner piezoelectric elements and fewer thicker elements should be sought to achieve optimal performance." (Mathieson[1], pp. 53 - 54)
In addition, changing the number of piezoceramics will affect the transducer's capacitance. For example, consider a design where the piezoceramic thickness is halved while maintaining the total piezoceramic stack height. This doubles both the number of piezoceramics and the capacitance of each piezoceramic so that the total transducer capacitance increases by a factor of four. DeAngelis[2] (p. 1) notes that this may lead to drive problems.
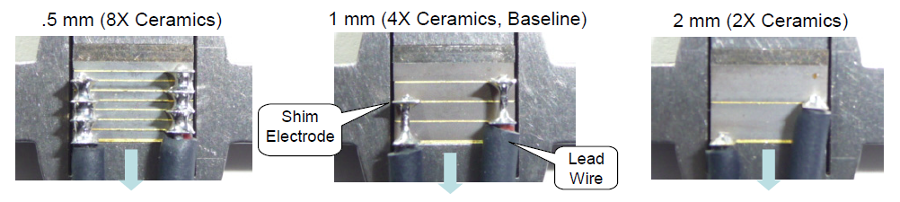
To investigate the effect of piezoceramic thickness, DeAngelis[2] conducted a series of tests on 120 kHz wire bonding transducers using PZT8 piezoceramics. All piezoceramics were from the same powder and production lot. The transducers were subjected to stabilizing heat-treatment after build. Three piezoceramic thicknesses were evaluated but the total height of the piezoceramic stack was kept constant by adjusting the number of piezoceramics (figure 19).
|
|
|
The test transducers were driven at series resonance. At series resonance the impedance is low; thus, a relatively low voltage (but relatively high current) is needed to achieve the required power output. (Note: For parallel resonance the impedance is high so a high voltage is required. In order not to exceed the allowed piezoceramic field strength the piezoceramic thickness must therefore be limited. This thickness limitation may not be optimal for other performance parameters.)
Performance was evaluated based on zzz ...
As shown in figure 10, the dielectric loss (\( tan\delta \)) increases as the field strength increases.
Total piezoceramic thickness
Number of piezoceramics
Ideally, the number of piezoceramics would be the total piezoceramic thickness divided by the optimum piezoceramic thickness. If this yields an odd number then this is generally rounded to an even number so that the end surfaces of the piezoceramic stack that contact the front driver and back driver are both at ground potential.
If an odd number of piezoceramics is desired then one end of the piezoceramic stack would be at ground potential while the other would be "hot". This would result in a short through the stack bolt which connects the front driver and back driver. This problem can be avoided by placing an insulator at the interface of the "hot" piezoceramic surface and the mating driver surface. (See electrical isolation.)
Stabilization
The properties of piezoceramics will change ("age") with time. This will affect the transducer's performance. Hence, the piezoceramics should be stabilized (to the extent possible) before the transducer is shipped.
The initial stabilization simply allows the piezoceramics to age in an unstressed condition, typically for 100 days after poling. The piezoceramics can also be prestabilized by heating to about 200 °C for about an hour. (Berlincourt[1], p. 11) However, Morgan Electro Piezoceramics states that this process is normally only applied to PZT‑4. (Berlincourt[2], p. 1)
When the piezoceramics are assembled in a transducer, a new aging cycle begins when the prestress is applied. To accelerate this aging the transducer may be thermally cycled in an oven or may be cycled ultrasonically, often at somewhat overstress.
http://www.morgantechnicalceramics.com/sites/default/files/documents/chapter6b.pdf
Electrodes
Electrodes provide an electrical path from the power supply to the piezoceramics. For Langevin type transducers operating in the \( d_{33} \) mode, the electrodes are placed between adjacent piezoceramic disks. To the extent possible, the electrode material properties should be compatible with the piezoceramics in order to avoid unnecessary stresses. The following table compares the properties of electrode materials to piezoceramic materials.
|
||||||||||||||||||||||||||||||||||||||||||||||||||||||||||||||||||||||||||||||||||||||||||||||||||||
|
Notes:
- Piezoceramic property values depend on many factors including static stress, dynamic stress, electric field strength, and temperature. Young's modulus depends on whether the piezoceramic is at open circuit or short circuit condition. Also, piezoceramics are anisotropic. Therefore, the table values are approximate.
- Young's modulus for piezoceramics were taken as 1/compliance (i.e., 1/s33).
- The relative transverse mechanical strain \( \epsilon_t \) is the Poisson coupled transverse strain at 1 Pa axial stress (i.e., Poisson's ratio \( \nu \) / Young's modulus \( E \)).
- Electrode materials that are used by or suggested by —
- Nickel —
Branson Ultrasonics - half hard
Prokic[1] — 0.25 mm thick, 100 HV (Vickers ) - 140 HV (p. 6-3) - Stainless steel —
Harwood patent 5,798,599 (Dukane) — 0.13 mm thick (p. 3 line 41) - Beryllium copper —
Herrmann Ultraschalltechnic — "Copper-beryllium is used because it has high thermal and electrical conductivity. It is also strong and has high dimensional stability under thermal loading." (p. 18)
Waanders — 0.25 mm thick (p. 48) - Copper —
Hulst — very soft annealed (p. 285)
Neppiras[1C] (p. 301)
Radmanović (p. 21) - Brass —
DeAngelis[2] (p. 4) - Invar —
Jones patent 3,283,182
Maropis[1], p. 133
- Nickel —
- http://www.morgantechnicalceramics.com/sites/default/files/documents/tp235.pdf suggests phosphor bronze or monel mesh bonded with resin. However, may not be able to plate phosphor bronze. zzz
- Note that Invar's coefficient of thermal expansion is comparable to that of the piezoceramic material. Thus, the piezoceramic should have little thermally induced stress from its contact with the Invar electrode. (Invar's fatigue strength is taken from Sokolowski.)
Design criteria
Under ideal conditions the following properties are preferred.
- As the piezoceramic expands laterally (due either to thermal expansion at the operating temperature or sterilizing temperature or due to Poisson coupling), stress will occur at the piezoceramic-electrode interface if the electrode does not naturally expand equally. In order to reduce these interface stresses:
- The electrode should have the same coefficient of thermal expansion as the piezoceramic.
- Poisson
- In order to accommodate mismatches in properties between the piezoceramics and electrodes, the electrodes should be as thin as possible. However, care must be taken that the unsupported portion of the electrode (that which extends beyond the piezoceramic-electrode interface) does not vibrate in undesirable ways which may lead to electrode fatigue.
- The electrode material must resist creep. Otherwise, the static prestress will be gradually released.
- The electrode's thermal conductivity should be high so that heat that is generated by the piezoceramics can be conducted away from the piezoceramics (e.g., into the front driver or back driver). However, this is not critical because the thermal conductivity of the piezoceramic is relatively low and the piezoceramic is much thicker than the electrode. Hence, the piezoceramic itself is the limiting factor in heat transfer.
In some designs the diameter of the electrode is made significantly larger than the piezoceramic diameter. The electrode's overhanging portion is exposed to the surrounding air so that heat that is conducted into the overhang will be convected into the air. In that case the electrode should be made thicker in order to aid the its conduction. (The effectiveness of this arrangement is not known. However, see the discussion of a similar design (Roberts patent 6,434,244‑B1, 2002) here.)
Prokic[1] (p. 6-3) states, "For electrode materials it is very important to use 99% nickel foils, or nickel-beryllium alloys, or some other nickel-rich alloys (which are relatively easy solderable, or where brazing can easily be applied, for creating good electrical contacts). Surface hardness of applied electrodes (empirically found as the best) should not be higher than 140 HV (Vickers) and not softer than 100 HV. Electrode-foil bands should be produced with cold drawing, without applying thermal treatment (resulting in relatively softer and more elastic alloys, with long fatigue-life). Electrode surfaces should be mirror and brilliant shiny, and extremely flat. Electrode thickness should be around 0.25mm. It is preferable not to apply any mechanical treatment on electrode surfaces (like polishing), because there is a danger to implement some hard particles in electrode surfaces (in any case, proper electrode cleaning should be applied in cases when any surface treatment is used)."
"The best materials for foil-electrodes of BLT are approx. 0.25mm thick foils, such as pure nickel (99%), or nickel, cooper, beryllium alloys (where nickel content is dominant). Material for production of foil electrodes should not be hardened (has to be very flat, very bright, to have almost mirror shiny surfaces, to be sufficiently soft and flexible, or half-hard, like in the case of elastic springs production: surface hardness between 100 HV and 140 HV is preferable). Foil electrodes could be produced using photo-chemical-etching technology to avoid formations of sharp edges. It is a common opinion that beryllium alloys are the best materials for contact electrodes of BLTs, but this is not correct, except if additional brilliant nickel plating, over such electrodes is applied (because beryllium itself is not sufficiently corrosion resistant, it has relatively high surface-friction coefficient, and under strong planar-radial vibrations starts degrading, separating cooper from beryllium)." Prokic[1] (p. 6-6)
Electrode arrangements
There are three common electrode arrangements.
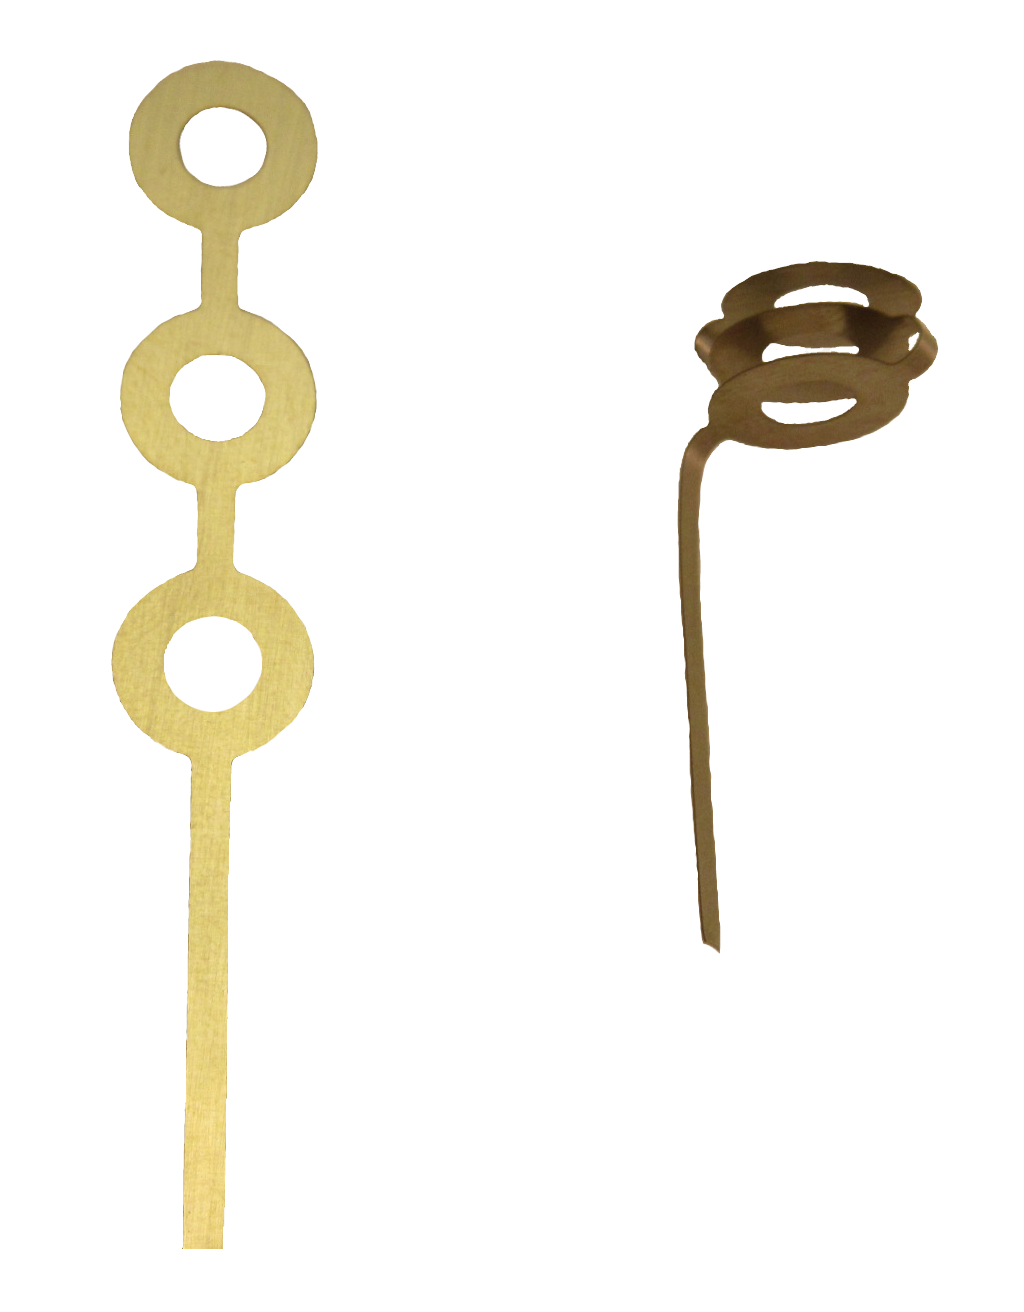
Disk with a tab extension
For a transducer with N piezoceramics, there are typically N electrodes (sometimes N+1), each with its own wire. All of the positive electrodes are tied together electrically by their individual electrode wires; similarly for the ground electrodes. The tab may have a hole through which the wire passes to additionally secure the wire.
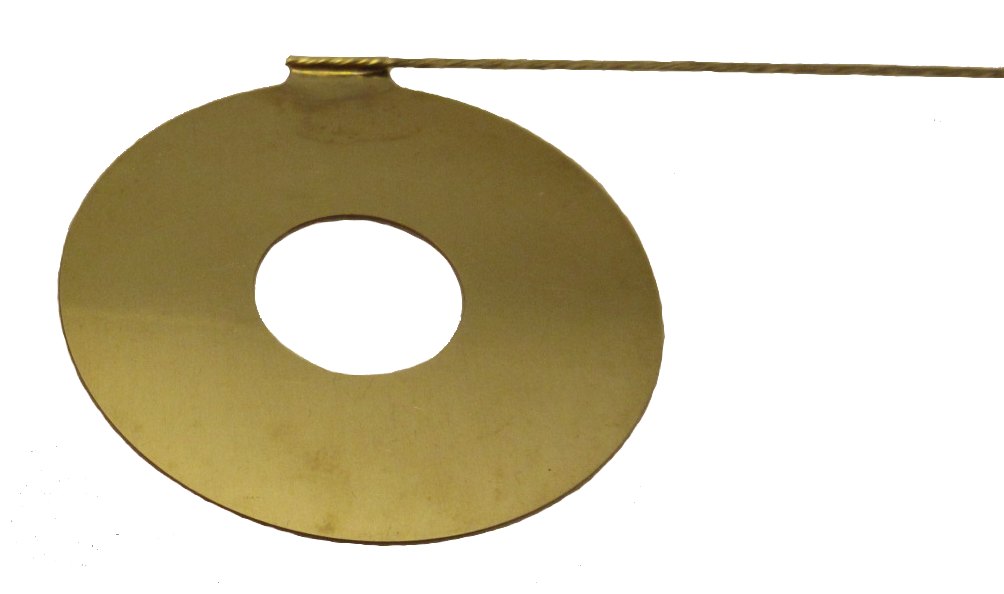
Depending on the materials, the wires can be attached by soldering, brazing, or welding (e.g., by resistance or electron beam). Soldering can be done before assembly (provided that the solder is kept clear of the eventual piezoceramic-electrode interface area) or after assembly. Brazing and welding must be done before the stack is assembled; otherwise, the piezoceramic may overheat locally near the braze or weld. Each wire is typically attached so that it aligns tangentially to the electrode periphery and generally in the same plane as the electrode. (However, see below.)
|
|
|
Attaching the wires very close to the piezoceramics allows a smaller transducer diameter. However, the wire will then vibrate with approximately the same amplitude as the piezoceramic. This may cause the wire to fatigue (typically where it attaches to the tab).
If a longer tab is used then the tab length must be tuned to provide minimum vibration amplitude. The wire is then attached at the tab's flexural node which reduces the liklihood that the wire will fatigue. This may require a larger diameter housing to accommodate the tabs.
Extended disk
Figure 21 (Neppiras[1C], p. 300) shows a transducer with extended electrode disks where the diameter of the electrode is significantly larger than the piezoceramic diameter in order to aid heat transfer. Heat is conducted into the overhanging portion and is then is convected into the surrounding air (or liquid coolant). In this case the electrode should be made thicker than usual in order to aid the conduction. (The effectiveness of this arrangement is not known. However, see the discussion of a similar design (Roberts patent 6,434,244‑B1, 2002) here.)
|
|
|
Serpentine arrangement
This arrangement uses only two pieces of electrode material, regardless of the number of piezoceramics. Here, the electrode disks are connected between piezoceramic surfaces of like polarity by a narrow strip of the same electrode sheet (i.e., one electrode snakes between the positive piezoceramic surfaces while the other snakes between the negative piezoceramic surfaces).
|
|
|
|
|
|
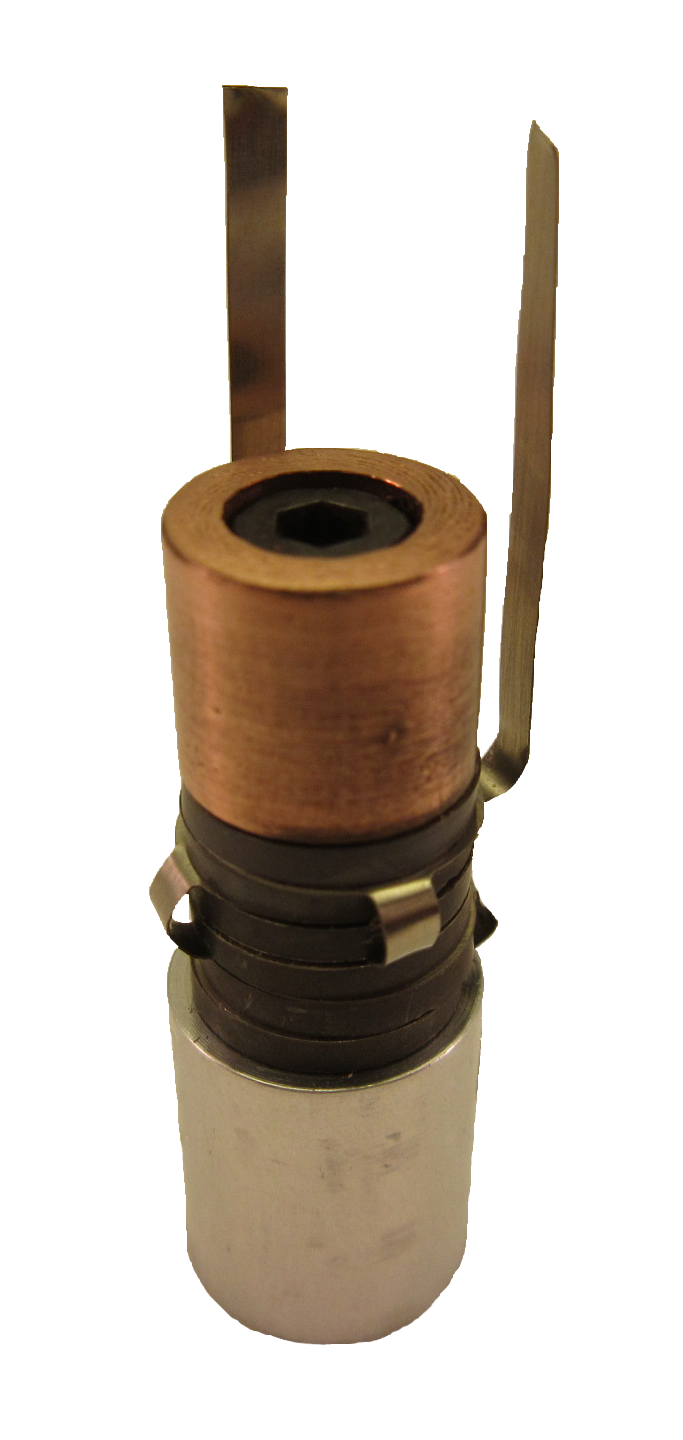
This design has several advantages over the tabbed disk —
- Depending on the design, the strip that joins the electrodes may protrude less than a tab. Hence, the transducer diameter can be smaller. This may be especially desirable for hand-held medical transducers.
- Regardless of the number of piezoceramics, only two electrodes are needed. Hence, only two terminating wires are needed for the external connection.
- Compared to tabbed electrodes whose wires are attached prior to assembly to the transducer, there is no possibility of contaminates (solder, flux, etc.) on the electrode contacting interface.
One disadvantage is that the electrode must be precisely bent into shape prior to assembly. Also, the serpentine shape makes the stack alignment more difficult so an alignment fixture is highly recommended.
Fatigue
The protruding portion of the electrode will vibrate, typically at the operating frequency of the stack. This vibration can be minimized by proper design and/or by damping the vibration (e.g., by applying a silicone RTV to the overhang).
Note that the fatigue strength generally increases with the material's hardness. However, if the electrode material is too hard then it may not conform as well to small irregularities in the surface of the piezoceramic. Therefore, a half hard condition has generally been specified. This is less critical if the piezoceramic and/or electrode have been plated with a compliant material (e.g., silver, gold).
Plating
It may be desirable to plate the electrode with the same material as the plating on the piezoceramic. This serves two purposes.
- The plating can fill small imperfections between the electrode and piezoceramic. This allows better coupling between the electrode and piezoceramic and lower loss. (See Branson patent 3,066,232.)
- Due to the static prestress, ultrasonic vibration, and temperature rise, the piezoceramics and electrodes may join together by diffusion bonding to create a monolithic stack. This eliminates the possibility that individual piezoceramics will slip laterally when excited ultrasonically. This may also provide better coupling and lower loss.
During the plating process plating may build up around sharp corners (e.g., at the outside and inside diameters). Then the electrode will not be flat and may not couple well to the piezoceramics. Hence, the electrodes may need to be polished or lapped after plating in order to remove this buildup. This also applies to plating on the piezoceramics. ZZZ
Plating thickness ZZZ
Manufacturing
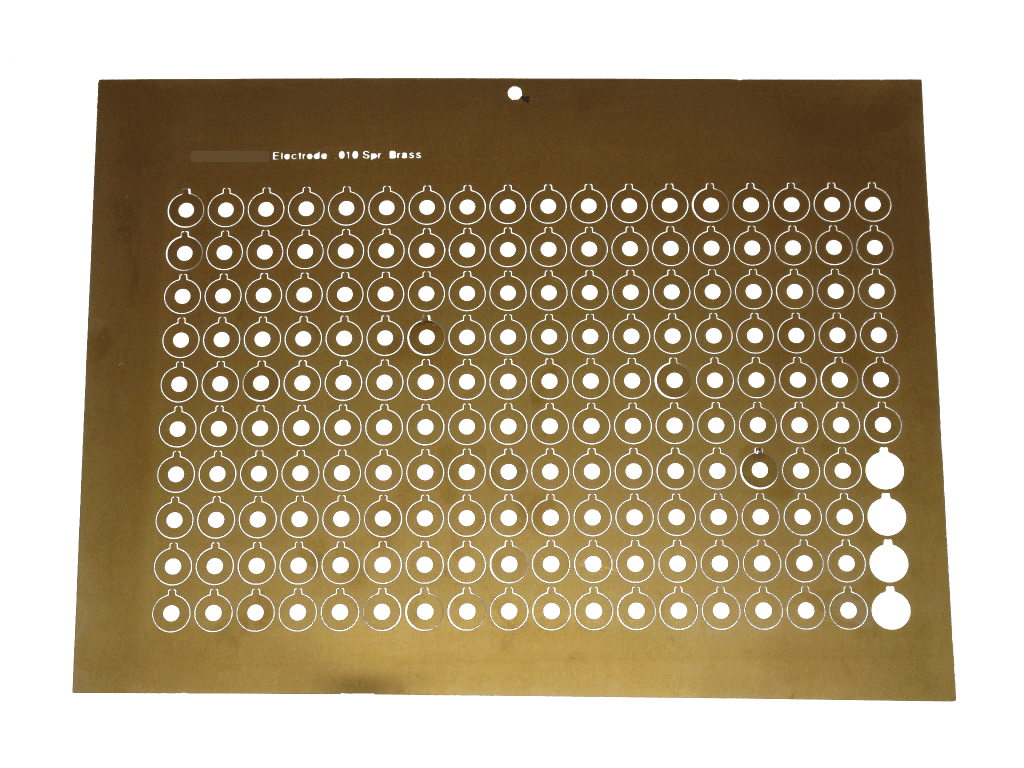
Electrodes should preferably be manufactured by photochemical etching. This assures that there are no imperfections (burrs, etc.) that might interfere with contact with the piezoceramics.
|
|
|
Back (rear) driver
The back driver distributes compressive prestress across the piezoceramics.
Materials
The following table shows the properties of common or suggested back driver materials.
|
||||||||||||||||||||||||||||||||||||
|
Table notes —
- 416 stainless is listed because of its superior machinability. However, there are other stainless steels that have similar acoustic properties. For example, 303 stainless and 316L (Branson Ultrasonics) are also used.
- Plansee Densimet® D176 (93% tungsten, 5% nickel, 2.5% iron) was chosen because because of its relatively high machinability (compared to pure tungsten). Also, there is some fatigue data for this alloy. However, other tungsten alloys may be equally suitable.
Compared to aluminum or titanium, steel back drivers have several advantages.
- Better prestress. Because steel has a higher Young's modulus, it is stiffer and hence the prestress will be applied more evenly across each piezoceramic.
- Shorter transducer. Because steel is denser the back driver will be shorter so the overall transducer can be somewhat shorter. (Note: shortening the back driver reduces its axial stiffness. Therefore, this somewhat offsets the above prestress advantage compared to if an equal volume of steel could have been directly substituted for aluminum or titanium.)
- Shorter stack bolt. Because the back driver is shorter the stack bolt can also be shorter. This may be helpful in dealing with flexure resonances in the stack bolt (i.e., a shorter stack bolt will shift the flexure resonances higher). Note, however, that a shorter bolt is not always beneficial. zzz
- Shifted secondary resonances. Because of its shorter length, the secondary resonances will shift. This shift could either be helpful or harmful, depending on exactly how these secondary resonances shift in relation to the primary resonance and to other secondary resonances.
- Reduced back driver amplitude. Because of steel's greater density and modulus, the rear driver will have reduced amplitude. If the rear driver is exposed to a liquid (e.g., for cooling) then the lower amplitude will reduce the acoustic energy that is undesirably transmitted into the liquid.
If the back driver is steel then stainless is preferred because of its corrosion resistance.
Tungsten alloys further maximize the above advantages. Radmanović (pp. 142 ‑ 144) used a 92W‑4Ni‑4Fe back driver for a 26 kHz transducer. Compared to a steel back driver, the back driver length decreased from 31.5 mm to 12.0 mm and the bandwidth increased somewhat. Tungsten alloy back drivers have also been used in sonar transducers.
The main disadvantage of steel is its relatively low thermal conductivity (25 W/m-°K) so heat will be conducted relatively slowly from the piezoceramics. Tungsten is about three times better while brass and aluminum are about five times better. Brass might be preferred to aluminum because its higher Young's modulus would give more uniform prestress across the piezoceramics. However, an aluminum back back would be longer so its increased surface area would aid in convective heat transfer. (See the section on cooling.)
Because the back driver is located near an antinode (where the strain is low), the resulting back driver loss is also low, regardless of the material. Hence, although both steel and tungsten (Mathieson[1], p. 58) have higher loss than either aluminum or titanium, they may be used as back drivers without concern.
Effect on output amplitude
Assume an idealized transducer where all static and dynamic stresses across any cross-section are planar. If the strain in the piezoceramics is maintained at a specified level then the chosen back driver material will only affect the back driver's amplitude, not the front driver's output amplitude.
In actual practice, however, the stress will not be planar but will be lower toward the periphery of the piezoceramics, particularly when the piezoceramic diameter is large. Then, substituting a stiffer material such as steel or tungsten will give more uniform stress across each piezoceramic. This might more effectively utilize the piezoelectric properties of the piezoceramics which could, in turn, increase the amplitude of both the back driver and front driver. zzz What if the piezoceramics aren't centered at the node?
This could be modeled by finite element analysis where each piezoceramic would consist of a series of concentric mating rings. Then the piezoelectric properties each ring would be adjusted according to the ring's static and dynamic stresses.
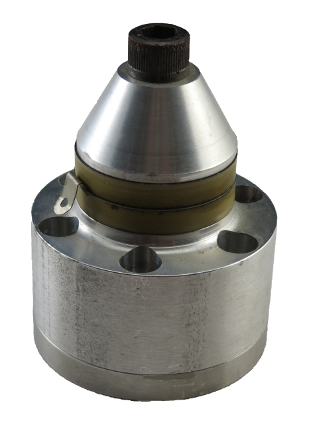
Shape — effect on bandwidth
The back driver is typically a cylinder with the exposed end surface parallel to the piezoceramic surfaces. However, Puskas[1] (pp. 5, 6) indicates that using a conical back driver can flatten the impedance curve, thereby increasing the transducer's bandwidth (reducing the quality factor Q). The effect on other performance parameters is not known.
The bandwidth is inversely proportional to the energy stored in the ultrasonic stack. Conical back drivers are used on transducers for cleaning tanks (figure 26). These transducers are attached directly to the cleaning tank (i.e., directly to the load) so the ultrasonic stack consists only of the transducer. Then, all of the system's stored energy is essentially confined in the transducer alone (neglecting the effect of the tank itself). In contrast, many other applications (e.g., plastic welding) add a horn and booster to the ultrasonic stack. These additional resonators significantly increase the system's energy storage. In such systems where the transducer's energy storage is a relatively small proportion of the total, a conical back driver may be less effective in increasing the bandwidth.
|
|
|
Dimensions
The back driver must be sufficiently thick (stiff) to apply reasonably uniform prestress across the piezoceramic stack. When the stack bolt is a socket head cap screw and the back driver is washer-shaped (not conical), a rough rule of thumb is that the thickness of a steel back driver should be at least 45% of the piezoceramic diameter. For other back driver materials the minimum thickness can be adjusted roughly inversely to their Young's modulus. For example, Young's modulus for aluminum is approximately 1/3 that of steel so the minimum back driver length should be three times greater than steel.
(The above thickness assumes that the stack bolt is a standard socket head cap screw which has a limited head diameter. If the socket head cap screw is replaced by a bolt with a larger head or a stud with a large diameter nut then the prestress will more uniformly distributed radially across the piezoceramic (i.e., better stress at the perphery). Then a thinner back driver could be used.)
The back driver's diameter must be at least as large as the piezoceramic diameter. However, an even larger diameter may be beneficial. Why? See zzz
The back driver may be counterbored for the stack bolt head, either to reduce the transducer's overall length or to allow a standard length stack bolt to be used. However, counterboring will somewhat reduce the uniformity of the prestress across the piezoceramics.
Front driver
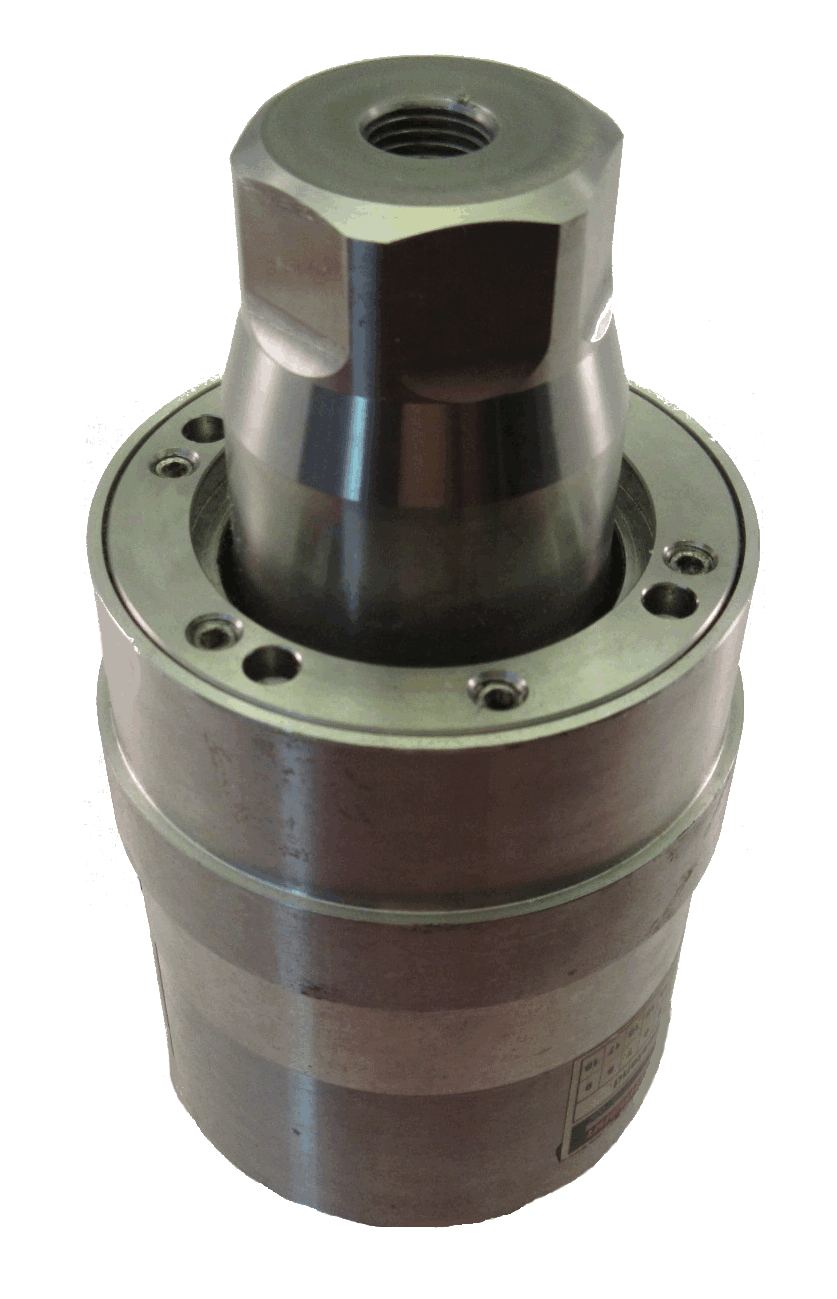
The front driver delivers the transducer's ultrasonic energy to the booster, horn, or probe. The front driver often includes a mounting flange for attaching a housing and may include cooling holes for forced air cooling. (See cooling.)
Excluding transducers for cleaning tanks, the front driver will have a means (typically wrench flats or spanner holes) for tightening to the booster or probe. Although spanner holes may be less expensive to machine, wrench flats are preferred because they will have less wear from wrenching. Also, spanner holes may not be suitable for small diameter front drivers (e.g., for surgical transducers).
|
|
|
Materials
Compared the the back driver, the front driver material is often less dense in order to give the maximum output amplitude (due to conservation of linear momentum across the node). The following table shows the properties of common or suggested front driver materials. (The properties of stainless steel (a common back driver material) and PZT piezoceramics are also included for comparison.)
|
||||||||||||||||||||||||||||||||||||||||||||||||||||||||||||||||||||||||||||||||||||
|
Notes —
- The listed yield strength for the piezoceramics is actually the tensile strength. However, it is assumed that the tensile strength is approximately the same as the yield strength, as is true of most piezoceramics.
- The yield strengths are for static tests. The dynamic strengths for the piezoceramics are considerably lower (24 MPa for PZT‑4; 34 MPa for PZT‑8).
Titanium
The table shows that titanium has high yield strength and high fatigue strength. However, it has relatively poor thermal conductivity so it will not be able to conduct piezoceramic heat well.
Aluminum
Aluminum has relatively low density (for highest amplitude) and good thermal conductivity. A disadvantage of aluminum (and also magnesium) is that the front threads (where the booster or horn stud engages) may wear more quickly from repeated tightening. Therefore, some designs incorporate a stud that is permanently installed in the front driver rather than in the mating booster.
Magnesium
Magnesium (suggested by Waanders, p. 44) has the lowest density of the listed materials and will therefore yield the highest amplitude. However, its thermal conductivity is inferior to aluminum. It also has the lowest yield strength and fatigue strength. Both of these strength problems can be mitigated by using a full length stack bolt that screws into a nut that is recessed in the face of the front driver. The stack bolt would then extend beyond the face of the front driver to allow a booster or horn to be attached. However, the extra length of the stack bolt may introduce unwanted stack bolt modes.
Multi-material
Compared to titanium, aluminum and magnesium have relatively low fatigue strength. This may lead to fatigue failures, particularly in the threads where the stack bolt engages the front driver. On the other hand, these materials have low density so the output amplitude can be higher than with titanium. These materials also have better thermal conductivity. A compromise is to use a two-part front driver — e.g., an aluminum base section (a washer whose outside diameter may be contoured) that mates to the piezoceramics and a following titanium nose output section. The stack bolt passes through a clearance hole in the base section and engages the threads in the titanium nose section, thereby compressing the base section between the piezoceramics and nose section. This approach avoids possible thread fatigue failure in the base section while still retaining the benefits of the aluminum or magnesium base section. The material and machining costs may also be lower than using an all-titanium front driver. This will require a longer stack bolt which may or may not be beneficial. This is the design that Branson used for their 10 kHz metal welders.
In addition, the front driver length can be reduced which may be an advantage in certain circumstances (e.g., for shorter medical handpieces). This happens when the base section has a low modulus (e.g., aluminum) and the nose section has a high density (e.g., titanium or steel). Since the resulting front driver is less stiff than if it had been made from the nose material alone, the front driver length must be reduced in order for the transducer to tune.
Plating
Aluminum and magnesium are normally plated, either for appearance or corrosion resistance. Platings include anodize, soft nickel, and chrome.
Thread engagement (center bolt design)
Thread engagement should be sufficient to prevent stripping of either the bolt threads or front driver threads. Thread engagement should not be excessive because the threads may be a significant source of power loss, especially if the threads are near the node.
Stack bolt
The following specifically addresses a transducer with a center stack bolt but is applicable to any member that applies prestress to the piezoceramics.
Desired characteristics
Low axial stiffness
The electromechanical coupling \( \kappa_2 \) will be maximized when the bolt has a low stiffness compared to the piezoceramics, thereby allowing the piezoceramics to expand relatively freely without being impeded by the bolt. Low bolt stiffness can be achieved by using a long bolt and by reducing the bolt diameter in the shank (non-threaded) area. (For example, see the transducer of figure 5a. By using a bolt with a reduced shank diameter, the thread diameter can remain large in order to absorb the bolt's prestress tension load.) Bolt stiffness can also be reduced by using a material with lower Young's modulus (e.g., titanium or beryllium copper instead of steel).
These conclusions can be seen from the equation for the adjusted coupling coefficient \( \kappa_2 \) —
\begin{align} \label{eq:10099a} {\kappa_2} &= \frac{1} { \sqrt{ \left({\Large\frac{1}{{\kappa_1}^2}} -1 \right) \left({\Large\frac{Y_b \, A_b \, / \, L_b}{Y_c \, A_c \, / \, (n \, L_c)}} +1\right) +1 } } \end{align}
where —
| \( \kappa_2 \) | = electromechanical coupling coefficient with the stack bolt |
| \( \kappa_1 \) | = electromechanical coupling coefficient without the stack bolt |
| \( Y_b \) | = Young's modulus of bolt |
| \( A_b \) | = cross-sectional area of bolt shank |
| \( L_b \) | = free length of bolt shank |
| \( Y_c \) | = Young's modulus of piezoceramic |
| \( A_c \) | = cross-sectional area of piezoceramic (i.e., the area of the individual piezoceramic's flat face) |
| \( L_c \) | = length (height) of individual piezoceramic |
| \( n \) | = number of piezoceramics |
The derivation of the above equation shows that \( \kappa_1 \) depends only on properties of the piezoceramic, not on the number of piezoceramics or other parameters —
\begin{align} \label{eq:10099b} {\kappa_1}^2 &= \frac{1}{{\left(\Large\frac{\varepsilon}{Y}\right) } \left(\Large\frac{1}{d_{33}} \right)^2 +1} \end{align}
where —
| \( Y \) | = Young's modulus of piezoceramic |
| \( \varepsilon \) | = piezoceramic permittivity [v/m] |
| \( d_{33} \) | = piezoelectric strain constant [m/v] charge constant [Coulonb/N] |
Equation \eqref{eq:10099a} shows that as the area of the bolt goes to zero (i.e., no bolt), the adjusted electromechanical coupling coefficient \( \kappa_2 \) just converges to the unadjusted electromechanical coupling coefficient \( \kappa_1 \). In practice, of course, the bolt must retain sufficient area to apply and maintain the required prestress on the piezoceramics.
Note: Equation \eqref{eq:10099a} applies when the displacements in the piezoceramic and the adjacent bolt section are equal. Under static conditions this will occur when the piezoceramic and bolt are simultaneously compressed between rigid anvils. In general this will not be precisely true for dynamic operation. Nonetheless, equation \eqref{eq:10099a} would still indicate the general trend. See further discussion of the electromechanical coupling coefficient.
Figure 28 shows the effect of bolt area on the coupling coefficient.
|
|
|
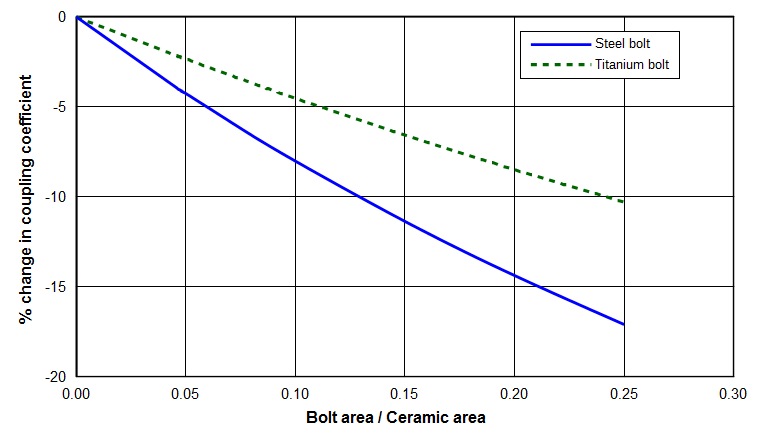
Consider the transducer of figure 1. The stack bolt has a diameter of 12.7 mm (area = 127 mm2) and the piezoceramic has an outside diameter of 50.8 mm and an inside diameter of 20.3 mm (net area = 1703 mm2). The ratio of bolt area to piezoceramic area is then 0.074. From figure 28, the presence of a steel bolt reduces the coupling coefficient by 6.1% compared to a transducer without a bolt. Some other stack bolt parameters are shown in the following table. Note that a Ø12.7 mm steel bolt is three times worse than a Ø9.5 mm titanium bolt (2.0% reduction). Practically, however, this requires that the Ø9.5 mm titanium bolt should be able to resist the associated static and ultrasonic stresses. Of course, a titanium bolt would be more expensive than a steel bolt so the improved performance with titanium might not be cost effective.
|
|||||||||||||||
|
Compatible front driver stiffness
The front driver stretches as the transducer vibrates; likewise the bolt threads also stretch. However, when the front driver material and bolt material are not the same, the preferred amount of stretch for each is not the same. For example, the threads of a steel bolt would tend to stretch only 1/3 as much as the mating internal threads of an aluminum front driver because steel's Young's modulus is three times higher. This incompatiblity can cause heating where the threads mate due to sliding friction; it can also cause undesirable stress in the front driver threads which can lead to front driver fatigue failures. This problem can be reduced by using a bolt material with lower Young's modulus (e.g., titanium) or by counterboring the bolt in the threaded area in order to reduce its stiffness (as is done by Branson for their 500/900 series transducers).
Compatible coefficient of thermal expansion
When the transducer operates at high temperature (either due to losses during high power delivery or due a high temperature environment), the stack bolt and piezoceramics will expand. The piezoceramics have a very low coefficient of thermal expansion (typically ~1.7 x 10⁻⁶/°C). The comparative values for titanium and carbon steel bolts are 8.6 x 10⁻⁶/°C and 12.3 x 10⁻⁶/°C, respectively. (The material for the referenced steel bolt is 4140, taken from Unbrako, p. 70.)
Note that the actual expansion of each component also depends on its temperature. Because most of the heat is generated within the piezoceramics, their temperature will be higher than the bolt. Thus, the difference in expansion between the piezoceramics and bolt will not be as great as might be assumed from their coefficients of thermal expansion alone. None-the-less, the bolt will likely expand more than the piezoceramics so the the room temperature compressive prestress on the piezoceramics will be at least somewhat reduced. This will be especially true under a high duty cycle where the temperature throughout the transducer stack will tend to equalize.
To counteract this problem, Scarpa patent 3,140,859 uses Belleville springs under the bolt head (figure 29, p. 10; claim 15, p. 15)). If properly designed, such springs can apply a constant force over a relatively wide range of deflections. Thus, even when the stack bolt expands, the washers will continue to apply a uniform preload to the piezoceramics. In order to provide sufficient preload force while being limited to the diameter of the back driver, multiple stacked washers may be needed. This arrangement (even with a single washer) may generate excessive frictional heat at the washer interfaces.
|
|
|
High fatigue strength
In addition to the ultrasonic stress, the bolt will have high static stress due to the piezoceramic preload. This high tensile stress will reduce the allowed ultrasonic stress in the bolt (for example, according to the Goodman or Gerber failure relations). zzz give example. Thus, the nominal (unloaded) fatigue strength must be high in order to accommodate the added static prestress.
High yield strength
A high strength material allows a smaller bolt diameter for a given static prestress load. A a smaller bolt diameter permits a smaller piezoceramic inside diameter. Thus, more piezoceramic can be used if the piezoceramic outside diameter is maintained or a smaller piezoceramic outside diameter if the same volume of piezoceramic is maintained. A smaller diameter bolt also increases the electromechanical coupling (above).
Optimum material
Ignoring costs, titanium (such as Ti-6Al-4V) best meets the above requirements. (Titanium bolts are available from SPS. See TITAN Titanium Fasteners and TITAN Titanium Fasteners for High Performance Racing.) To reduce the material and machining cost, a titanium stud (without bolt head) could be mated to a steel nut at the back driver.
Length
Ideally the stack bolt should be as long as possible. This has two advantages.
- Improved electromechanical coupling. A long stack bolt reduces the stack bolt stiffness relative to the piezoceramics. (The best condition would be a bolt with zero stiffness. See above.)
- More uniform piezoceramic prestress. With a long bolt the point of application of the prestress force is farther from the piezoceramics. This gives a more uniform prestress across the piezoceramic diameter. This is more important for larger diameter piezoceramics where the periphery of the piezoceramics may be poorly supported.
Unfortunately, one problem with long bolts is that they are more likely to have undesirable secondary (flexural or longitudinal) modes near the primary mode. Such modes can cause high loss, damage to the piezoceramics or front driver, or bolt fatigue failure. DeAngelis (p. 20) recommends a 10% frequency separation for dry stacks and 20% separation for glued stacks.
If the bolt is sufficiently long then it can thread into the front of the front driver. In this antinode region the strain is low so the risk of fatigue failure is reduced. The threaded end of the bolt can even extend beyond the end of the front driver (i.e., as a replacement for the stud) so that a booster or probe can be attached. (See the design of Hulst, figure 5a.) For this design the bolt must be secured tightly to the front driver (e.g., by suitable thread lock) so that it can't loosen when the booster is tightened.
If loc-tited, can't retorque.
If the bolt is exactly designed (per Hulst) then the bolt will have the same resonance as the transducer and will not impose any additional stress on the transducer.
Note: Hampton[1] - bolt should be stretched at least 10x the expected amplitude.
Head diameter
In order to apply a reasonably uniform prestress to the piezoceramics, the head diameter should be an appreciable percentage of the piezoceramic diameter. In this case a stud with separate nut may be preferred. See figure 9 and the associated discussion.
Threads
From available thread pitches for a given bolt diameter, a fine pitch is generally preferred.
Electrical insulation
The piezoceramics must be protected against electrical arcing and also against moisture (which can contribute to arcing). Therefore, a conformal coating is applied to the exposed piezoceramic and electrode surfaces. This must be done after assembly so that the resulting coating is uninterrupted (i.e., all gaps, particularly between piezoceramics and electrodes are completely sealed).
In addition to high electrical and moisture resistance, the coating should have low mechanical loss when vibrated ultrasonically. Thus, the coating thickness should be small. Also, the coating's properties should should not degrade at the expected piezoceramic operating temperatures or environmental temperatures (e.g., if autoclaved). Numerous coatings have been used including magnet wire lacquers (e.g., Conap), silicone spray.
One problem with the center bolt design is that the interior piezoceramic and electrode surfaces can not be conveniently coated after assembly. Since these surfaces remain uninsulated, arcing may occur if the central bore is cooled with air that contains any moisture.
Some coatings such as Conap may take several days to cure completely. During this time the coating's mechanical ultrasonic loss will decrease. For example, figure 30 shows the curing data for two nominally identical 40 kHz transducers (Culp[0]). Therefore, loss tests should be postponed until the coating has completely cured.
|
|
|
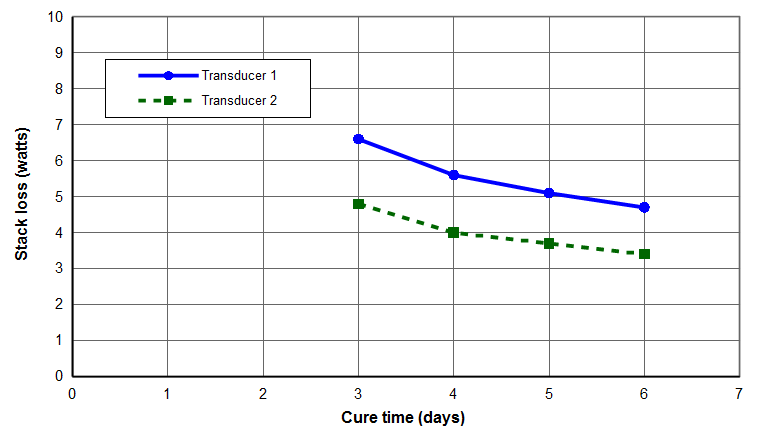
Electrical isolation
In some cases the piezoelectric stack must be electrically isolated form the rest of the transducer. In this case a thin insulator disk can be placed between the front driver and piezoceramic stack and also between the back driver and the piezoceramic stack. Macor® (a machinable piezoceramic) is commonly used. Although Mylar washers might be considered, these tend to creep under load (Dukane[1], p. 13) so that the initial static preload would decrease over time.
Housing
A housing is required in two circumstances —
- To protect the user from the high voltages and currents in the transducer. (A housing would not be needed where the user is not exposed — e.g., for transducers such as figure 26 attached to an enclosed cleaning tank.)
- To provide a method of supporting the transducer. For example, the housing might be clamped into a plastic welding stand or it might be part of a hand-held medical device. In this case the mounting must provide some rigidity so that the transducer body doesn't deflect unacceptably (either axially or transversely) under the applied loads.
The housing must be acoustically isolated from the transducer body so that the housing doesn't substantially vibrate. Otherwise, ultrasonic energy will be transferred to the housing.
See isolation mounts for details. Also see grounding.
Mechanical fits
All parts of the transducer must be carefully processed or machined to assure proper fits. This will assure that mechanical frictional losses are minimized and that maximum energy it transferred to the load.
Stack bolt threads
The stack bolt threads into the front driver. Two investigators indicate that properly machined and mated threads are important.
- Neppias — "The [transducer's] mechanical resistance, R*, is made up from: internal material-loss; losses at the contacting surfaces; and frictional damping in the screw-threads. The last named is by far the most important." (p. 298 )
"Dynamic frictional losses in the screw-threads account for most of the mechanical damping in the system, so that well-fitting threads are called for." (p. 301) - Maropis — Jones patent. Square threads. zzz
Flatness , parallelism, and finish
All mating surfaces should have high flatness. Preferably the required flatness can be substantially achieved during the machining process. However, final lapping (either by hand or machine) is recommended. Prokic[1] (p. 6-5) recommends 600 grit (or higher) polishing paper on a lapping machine that produces only planar (X-Y) motion. Each piezoceramic should be lightly pressed on each side for 5-10 seconds. The front driver and back driver can be laped under their own weights. (Note — hand lapping requires extreme care so that the surface doesn't become convex due to uneven lapping pressure.)
Harwood patent 5,798,599 (p. 1, line 32) indicates a required flatness within two Newtonian rings per inch and a surface finish within eight microinches roughness height, together which would normally require lapping.
The faces of the piezoceramics must be parallel to high tolerances.
If sufficient flatness, parallelism, or surface finish cannot be otherwise achieved then some investigators have recommended placing a conductive metal shim at each interface. This shim should be relatively soft (so as to flow into any voids) and nonozidizing. Suggested materials include soft nickel (Branson patent 3,066,232, p. 3) and dead soft aluminum grades EC‑0, 1100‑0 and 3303‑0 (Harwood patent 5,798,599, p. 4, line 12), typically 0.12 mm thick. Even when the above requirements are met, Harwood patent 5,798,599 (p. 6, line 9) shows that soft metal shims can still give substantial performance improvement. The following table shows such results from Harwood's tests of two sets of ten 40 kHz transducers, with and without the metal shims. Each transducer had two piezoceramics; those transducers with metal shims had five metal shims.
|
||||||||||||||||||||||||
|
Harwood notes that the shims are even effective on transducers whose surfaces have not been highly polished — such transducers showed performances that were "not significantly worse" than those in the above table.
Silver-filled epoxy resins have also been suggested. (See Jones[1], p. 15.) However, achieving a consistently uniform resin thickness may be difficult. This also complicates the assembly process.
Assembly
All components should be ultrasonically cleaned just prior to assembly.
Aligning the stack
An alignment fixture should be used during assembly to assure that all of the parts are centered with respect to the front driver. This can be done with a machined plastic sleeve that has cutouts for the electrodes. The sleeve's inside diameter is just slightly larger than the piezoceramic stack. After the sleeve has been slid over the back driver and piezoceramic stack, it is positioned about a reference surface (e.g., the front driver's mounting flange) and the stack bolt is tightened. The sleeve is then removed.
Alternately, an internal plastic sleeve can be used. The outside diameter is just slightly smaller than the ceramic inside diameter while the inside diameter is just slightly larger than the stack bolt diameter. The sleeve length is somewhat longer than the ceramic stack height so that the ends of the sleeve fit into shallow alignment counterbores in the front and rear drivers. This sleeve remains in place after assembly and serves as an insulator to prevent arcing between the electrodes and the stack bolt. In this respect it may be preferable to the method of the previous paragraph.
Anti-rotation
As the stack bolt is tightened, the front and rear drivers must be secured to prevent torsional stress on the ceramics and to prevent the electrode tabs from rotating out of position.
Transducer failure modes
The following are common failure modes for transducers.
Piezoceramic overheating
As the piezoceramic temperature increases the piezoceramic electromechanical properties change, generally in a nonlinear manner. This changes the transducer's performance. For example, see figure 31. If the temperature is not too high then the change may be reversible; otherwise, the change will be permanent.
|
|
|
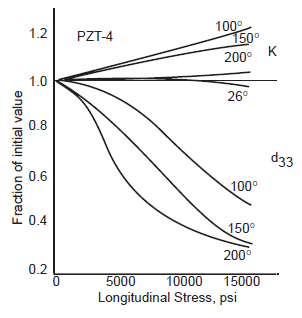
Although the maximum temperature is often simply specified as a percent of the Curie temperature (e.g., 50% - Waanders, p.6), this is a very inexact guideline. For example, "The material's temperature limitation decreases with greater continuous operation or exposure." (Vernitron, p. 14) Figure 7a and figure 31 show that, in order for \( d_{33} \) not to degrade below a certain value, the prestress must be reduced when operating at higher temperatures. For example, if \( d_{33} \) must be maintained at least 70% compared to its unstressed value, then figure 7a shows that operation at 100°C would allow a prestress of ~72 MPa whereas operation at 200°C would allow a prestress of only ~32 MPa.
Temperature concerns fall into two categories —
- The piezoceramic properties may be permanently altered.
- The performance of the transducer (e.g., the amplitude) may change as the temperature increases, regardless of whether these changes are ultimately reversible when the transducer cools. Thus, an application that is successful when the transducer is cool may be unsuccessful as the transducer's temperature increases.
|
|||||||||||||||||||||||||||||||||||||||||||||
|
Table notes —
- Prokic[1] — Suggests a preferable limit of 60°C for PZT8 but in any case not more than 90°C for continuous (heavy duty) operation. "If piezoceramics in operation reach temperatures between 150°C and 180°, efficiency of transducer will drop significantly."
- Stapla Ultrasonics[1] — "The function of the converter will be massively affected if the operating temperature raises above 60°C."
- Bromfield[2] — "The temperature of the end mass was also measured and limited to a maximum of 600°C to avoid damaging the piezo rings." This is apparently a misstatement (should be "60°C"). This is correctly stated in Bromfield's European patent (Bromfield[3]).
- Where the piezoceramic type is "not specified", these are typically either PZT4 or, more often, PZT8 for power applications.
Electrical arcing
If the piezoceramic voltage is sufficiently high or if a conduction path is available then the piezoceramics may arc. In addition, high piezoceramic voltage leads to high loss (nonlinear); typically limited to loss tan of 0.04. See Butler[1] article.
|
|
|
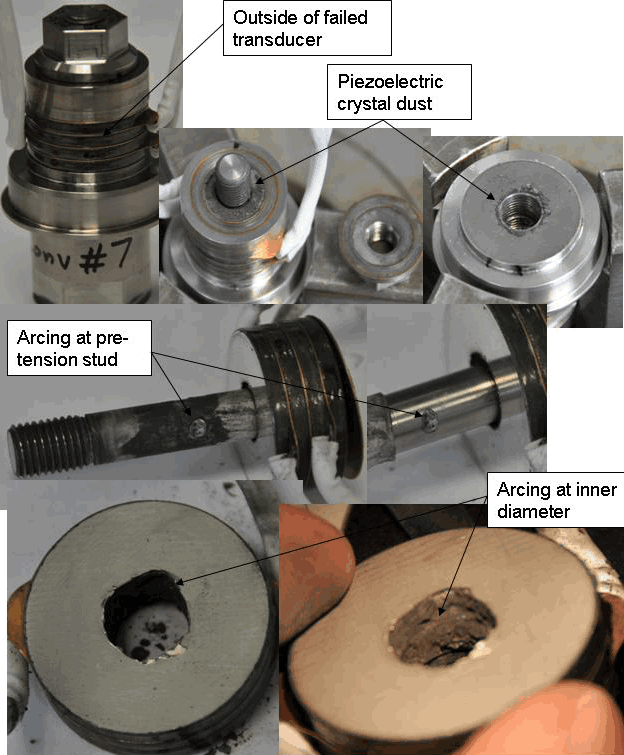
Stack bolt failure
Shifted or cracked piezoceramics
Shifted or cracked piezoceramics generally result when there is some unbalance in the stack or when the stack is subjected to some type of shock loading (e.g., hammering against a metal insert).
As an example of an unbalance problem, figure 33 shows a Branson metal welding apparatus (per Shoh[2]). The original prototype was 10 kHz with Ø76 mm piezoceramics. Despite applying huge torque (1m wrench + 1m extension + 2 men) to the stack bolt, the piezoceramics repeatedly failed by slipping and cracking. This was caused by unbalance in the horn due to the welding tip (part 40) which was offset from the stack centerline, thereby causing flexure waves in the stack. The problem was initially solved by inserting a plug on the opposite (top) side of the horn in order to counterbalance the weight of the offset welding tip. (Culp)
|
||||||||||
|
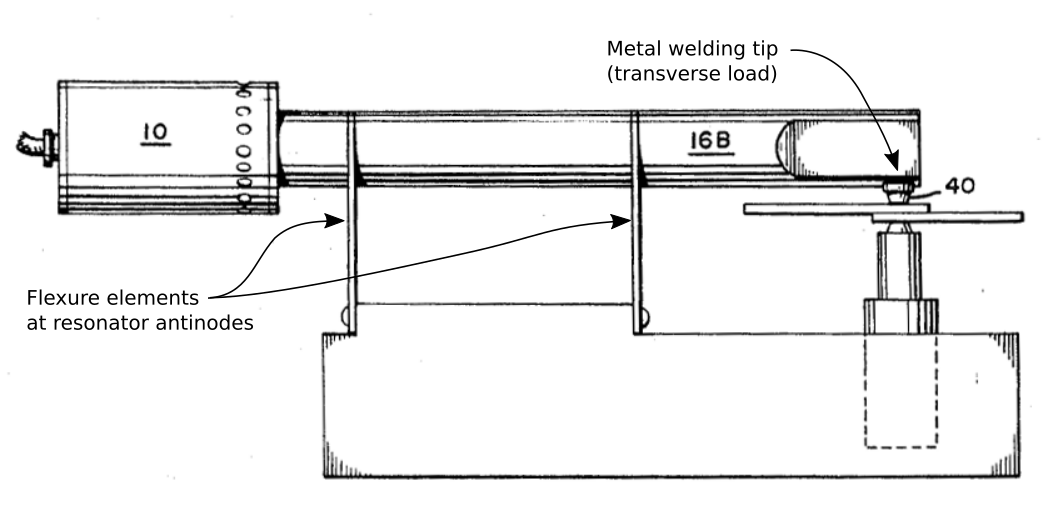
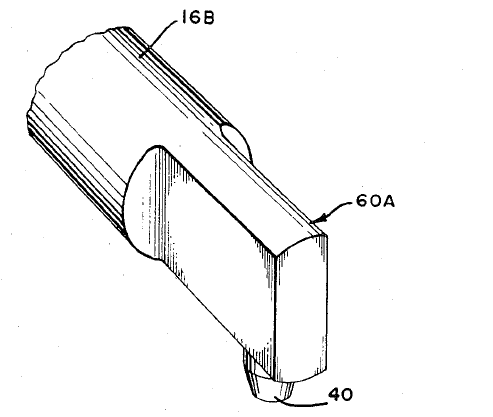
The problem of unbalance also occurs in contoured horns and medical probes that are bent. The unbalance in contoured horns can be reduced by shifting the contour location or by reducing the contour depth. The unbalance in bent medical probes can be improved by changing the size or location of the bend radius.
|
|
|
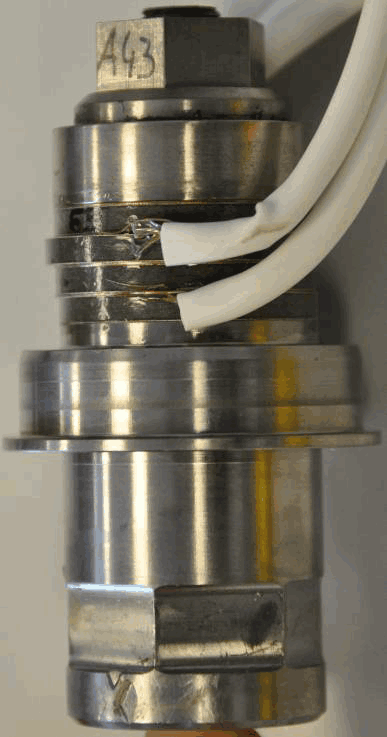
The problem of shifted piezoceramics can be reduced if appropriate platings are used on the piezoceramics and electrodes. After assembly (and possibly some run-in time) the piezoceramics and electrodes become a zzz monolythic stack by diffusion bonding. (See above.) Then, individual piezoceramics can't shift; instead, the entire stack must shift.
|
|
|
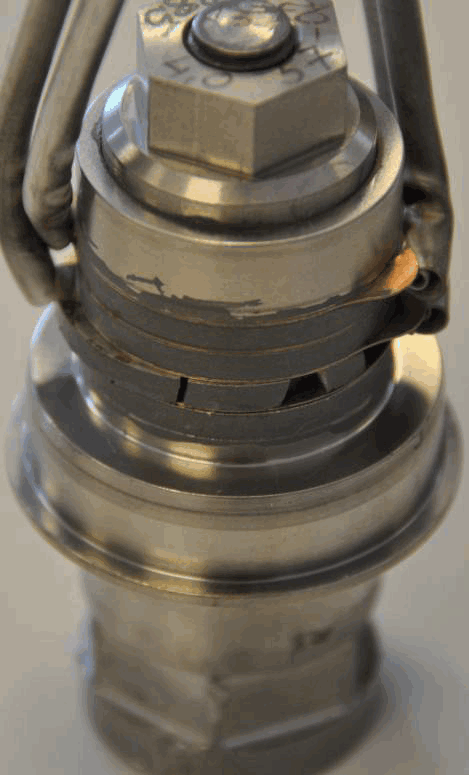
Fatigued electrode tabs or wires
Testing prototype designs
Loss tests
Transducer losses have two components — electrical losses and mechanical losses. It is desirable to distinguish between these so that they can be separately minimized.
Electrical losses
Electrical losses are primarily dielectric although some piezoceramic resistance is also present. With a well-designed and well-assembled transducer, these are the losses that cause piezoceramic heating.
Electrical losses can be determined by two methods.
- With a single transducer, each pair of piezoceramics is driven such that the voltages are 180° out of phase (i.e., when the voltage on one piezoceramic is positive, the voltage on the adjacent piezoceramic is negative, and vice versa). Krueger[1] (Appendix A, p. 8) used this method.
- Two nominally identical transducers are assembled as shown in figure 38. In this case, both transducers are simultaneously driven in-phase by the same power supply (rather than having the test transducer connected to a load).
In both methods the drive frequency is the normal operating frequency.
In the first method each pair of piezoceramics is attempting to expand or contract at the same time. In the second method both transducers are attempting to expand or contract at the same time. In both methods the resulting opposition forces prevent the transducers from vibrating. Thus, all mechanical (vibrational) losses are removed, leaving only the electrical losses. (In the second method the electrical losses from both transducers.)
Note — The second method is more physically complicated and may also require power supply adjustments in order to compensate for the capacitance of two transducers (rather than a single transducer).
This test would be useful when evaluating piezoceramics from different manufacturers, assuming that the piezoceramics are otherwise prepared to the same mechanical specifications (flatness, parallelism, finish, etc.). This can also help to determine if there is a drive level at which the losses suddenly start to increase. Then the drive level should be kept below this critical limit except for short burst intervals.
Mechanical losses
Mechanical losses result from straining of the various components and from friction at the interfaces (at the piezoceramic faces, the bolt threads, etc. These losses can be determined by operating the transducer under power (see the power loading tests) and then subtracting the electrical losses as determined above.
The measured mechanical losses can be used to see the effect of changing surface finishes, piezoceramic insulation materials, thread locations and specifications, etc.
Power (loading) tests
To a large extent the power a transducer can deliver depends on the ability to maintain an acceptable piezoceramic temperature. For a given design this means that piezoceramic heat must be removed, both by conduction and convection. As the delivered power increases the power dissipated in the piezoceramics also increases. Thus, conduction may be effective at low power but convection is necessary at higher power. At even higher power convection may not be sufficient in which case the duty cycle must be reduced (i.e., the transducer's nominal power must be derated).
The transducer must be loaded in steps in order to determine its power handling capability. The loading procedure is —
- Machine a longitudinal slot in the housing through which the piezoceramics are visible. Cover this slot with a transparent plastic film to prevent cooling air from escaping. This slot will be used to measure the piezoceramic temperature with an infrared thermometer.
- Specify —
- The maximum acceptable piezoceramic temperature. (affected by prestress - See zzz.)
- The "on time" for when the duty cycle is less than 100%. The on-time will depend on the intended application. For example, for ultrasonic plastic welding the on-time might be specified as 2 seconds. For an ultrasonic medical device the on-time could be significantly longer. (zzz average or max?)
- Set the air flow rate for the subsequent series of tests.
- Start with a 100% duty cycle (i.e., continuous ultrasonics).
- Adjust the load to achieve a specified input power (typically as measured with a wattmeter).
- Maintain the ultrasonics until the temperature of the piezoceramics has stabilized. The temperature should be measured at the piezoceramic with the highest temperature (typically the piezoceramic closest to the node).
- If the stabalized temperature is less than the maximum acceptable temperature then record the data and increase the load (i.e., increased power). Repeat steps 5 and 6.
- If the stabalized temperature exceeds the maximum acceptable temperature then reduce the duty cycle (i.e., increase the "off time" while maintaining a consistent "on time"). Repeat steps 5 and 6.
- Repeat steps 5 and 6 at increasing loads until either the maximum expected power has been achieved or the lowest expected duty cycle has been achieved.
zzz Monitor amplitude?
The above procedure should be repeated for several well-aged transducers so that an average can be determined. The following graph shows the results of loading tests for a single 15 kHz transducer whose design is similar to that of figure 1.
|
|
|

(Note: SCFM = Standard Cubic Feet per Minute.)
Thus, given sufficient air flow, the transducer can operate at 100% duty cycle (i.e., continuous sonics) up to about 1700 W. For any power above 1700 W, the duty cycle must be decreased in order to maintain the piezoceramic temperature. At 3500 W the duty cycle must be reduced to 50% for 80 SCFM and 35% for 50 SCFM — i.e., the transducer must be derated from its operation at continuous sonics. Hence, three parameters must be specified when listing a transducer's power rating — 1) the power output, 2) the cooling fluid (typically air) and the flow rate, and 3) the duty cycle.
For this 15 kHz transducer the total piezoceramic volume was 98 cm3. Then the graph of figure 36 can be normalized to give the power densigy (watts per unit volume of piezoceramic volume).
|
|
|

Then, given sufficient air flow, the transducer can operate with continuous sonics up to about 17 W/cm3 of piezoceramic or 35 W/cm3 of piezoceramic at 50% duty cycle and 80 SCFM. Dividing by the frequency in kHz gives 1.2 (W/cm3)/kHz and 2.3 (W/cm3)/kHz, respectively. These values are consistent with those of table 10 for a transducer with offset piezoceramics.
Loading methods
In order to determine the transducer's power handling capability, it must be loaded so as to maintain a reasonably stable power level until the piezoceramic temperature has stabilized. Two methods are commonly used.
Water loading
For water loading the transducer is connected to a booster and horn (typically a bell horn). The horn is then immersed in water until the desired power has been achieved. The horn should be immersed at least 15 mm to avoid power fluctuations due to surging water around the horn's face. The booster may need to be changed in order to achieve the desired operating conditions. During the test the power may vary somewhat as the transducer's amplitude drifts. (This drift would be due to piezoceramic heating and frequency drift, and would depend on the ability of the power supply to compensate.) However, the power can easily be adjusted by changing the horn's immersion depth.
Electrical loading
For electrical loading the test transducer is driven by a drive transducer which is connected to a power supply. An intermediate booster may be used to provide gross amplitude adjustment to the test transducer. In some cases the intermediate booster may be required in order to stabalize the system, even if the booster has just 1:1 gain. The terminals of the test transducer are connected to a variable electrical load (e.g., a high-power resistor) or electronic load. A wattmeter measures the output power to the load. (This power measurement does not include any power that is dissipated within the test transducer. Hence, if this transducer were used in an actual application, rather than in this test situation, then this measured power would represent the input power to the transducer (i.e., as measured by a wattmeter).) Figure 38 shows the arrangement (after Hampton[1], p. 58).
|
|
|
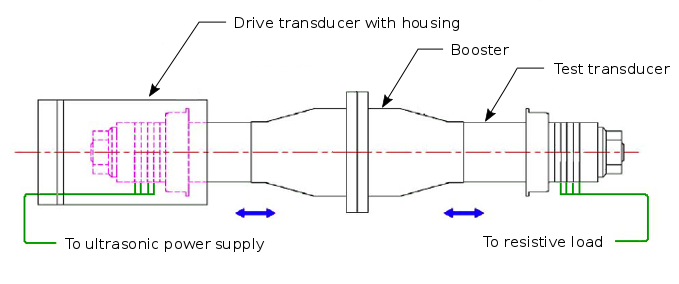
For this arrangement the driving and test transducers should have the same nominal frequency. However, the design of the test transducer could be completely different than the driving transducer. Thus, a new transducer design could be driven by an off-the-shelf transducer and power supply. Then the power characteristics of the test transducer could be evaluated independently and in parallel with the development of its new power supply.
Arcing tests
Sensitivity to unbalanced horns
Performance
Amplitude
Typical 20 kHz half-wave transducers for industrial applications (e.g., plastic welding, metal welding) have output amplitudes in the range of 5 to 10 microns (peak) at no‑load. With properly designed power supplies, this no‑load amplitude can be substantially maintained under load.
|
||||||||||||||||||||||||||||
|