Titanium
Contents
- Uses
- Cross references
- Properties
- Ti‑6Al‑4V (ASTM grade 5)
- Machining
- Recommendations
- Appendix A - Young's Modulus for Ø38.1 mm Ti‑6Al‑4V Rod
- Appendix B - Young's Modulus for Ti‑6Al‑4V Plate
- Appendix C - Titanium with Low Young's Modulus
- Appendix D - Titanium for Biomedical Use
- Appendix E - Other Titanium
Uses
Titanium alloys are used for their combination of good acoustic properties.
- Long life for highly stressed resonators.
- Biological compatibility for surgical instruments or implants.
- Moderate resistance to impact, wear, and cavitation erosion.
- Chemical resistance.
However, titanium is relatively expensive so other materials should be used where appropriate.
Applications include medical (surgical), plastic and metal welding, liquid processing, and food packaging and cutting.
Cross references
A specification cross reference for various grades of titanium can be found here. This cross reference includes U.S., British, French, and German designations.
Properties
Orthotropic considerations
Titanium is orthotropic which means that the material properties depend on the direction in which the material is tested with respect to the grain direction. The grain directions are commonly labeled as longitudinal L (i.e., parallel to the grain), transverse T (also called long transverse LT), and short transverse ST. See the following figure from Bowen (p. 1273).
|
|
|
Bowen (p. 1272) lists the following properties for this material. Note the substantial dependence on the test direction.
|
||||||||||||||||||||||||
|
Table notes:
- The material is Ti‑6Al‑4V, forged and annealed, 235 mm wide x 57 mm thick .
- E = Young's modulus.
- The thin wire wave speed C0 is calculated as √(E/ρ) where the assumed density ρ is 4430 kg/m3. These C0 values were not included in the original table.
- The fatigue strength is approximate at 107 cycles.
For titanium Young's modulus and the wave speed depends on the following factors:
- The direction of vibration with respect to the grain direction (see the table).
- The position of the raw material along the length of a bar.
- The heat from which the sample was produced. Variations may also occur from different samples of the same heat (see below).
- The raw stock type (rod, bar, sheet, or plate).
- For rod material, the raw stock diameter (see below).
Thus, because the wave speed or modulus of titanium may not be precisely known, the tuned length of a titanium resonator will not be entirely repeatable and may not be precisely predicted, even using computer simulation.
Cross rolling
Titanium's directionality can be reduced by cross rolling. In this process the plate material is successively rolled in transverse directions as its thickness is reduced. Arthington (p. 6) reports that TIMET uses this process for critical reliability aero-engine compressor blades manufactured by Rolls Royce plc.
Loss (Q)
Variation with grain direction
Limited experimental data suggest that the loss depends on the vibration direction relative to the grain.
Fatigue characteristics
Titanium alloys have an endurance limit (stress) below which the material will have infinite life. However, the exact value of this endurance limit is somewhat difficult to determine. See the discussion below for Ti‑6Al‑4V.
Wear
Titanium's wear resistance is substantially better than aluminum but not as good as steel. Several methods are available for improving the wear resistance.
Inserts
Titanium-carbide (TiC) inserts can be brazed to titanium flat faced horns.
- For high amplitude bar horns, experience has shown that the insert thickness should be less than ~1.8 mm in order to limit the inertial forces which could cause the insert to detach from the horn. Also, since carbide is relatively brittle the width of each insert should be limited to about 25 mm so that the carbide doesn't crack due to nonuniform amplitude on the horn's face. Of course, these suggested dimensions may be adjusted depending on the horn's amplitude and uniformity.
- Special care must be taken during brazing to insure a strong horn-carbide joint.
- The density of tungsten carbide (15600 kg/m³) is about three times greater than titanium carbide (4930 kg/m³). Use of tungsten carbide would then result in 3x greater stress on the horn-carbide joint. Hence, titanium carbide is generally preferred over tungsten carbide.
Coatings
Unlike inserts, coatings can be applied to non-flat surfaces but generally have somewhat limited thicknesses. Also the application process may be easier. However, many coatings should not be applied to highly stressed regions because this may reduce the horn's fatigue life. Thus, masking of the horn may be needed.
D‑Gun
D‑Gun is a proprietary process developed by Union Carbide and now offered under Praxair. A number of coatings are available, typically with thicknesses up to about 1 mm in ultrasonic applications.
For one automotive customer who was ultrasonically staking a glass-filled resin, a D‑Gun coating of 0.025 mm - 0.050 mm resulted in eight times the normal wear life. At the end of the wear life the remaining D‑gun was stripped and the horn was recoated.
LW‑1N30 (principally tungsten carbide, Rc 70) has been used successfully when applied to aluminum 40 kHz loom slitter horns (to slit and simultaneously seal cloth edges as the cloth is woven in a loom).
Ti‑6Al‑4V (ASTM grade 5)
When a titanium alloy is required, Ti‑6Al‑4V (6% aluminum, 4% vanadium) is most commonly used, in part because it is widely available. Also, because this alloy is widely used for non-ultrasonic applications (particularly aerospace), a huge knowledge base has been compiled. Ti‑6Al‑4V is approved in the U.S. and other countries for ultrasonic surgical devices.
Note that Ti‑6Al‑4V only designates the chemical composition. Some properties (and, hence, performance) may vary considerably depending on factors such as grain direction, heat treatment, processing, etc.
Loss (Q)
As indicated by the following table, Ti‑6Al‑4V has the lowest loss (highest Q) in the annealed condition. (The raw stock for all of these tests is believed to be cylindrical.)
|
||||||||||||||||||||||||||||||
|
Notes:
- The Wuchinich (2) material was heated to 940 °C (1725 °F) for one hour and then water quenched, giving a Rockwell C hardness of 65 (p. 4).
- The Mason (1) material was annealed in a vacuum at 750 °C (1380 °F) - 760 °C (1400 °F) for one hour.
Mason (1) measured a sample of annealed Ti‑6Al‑4V at 17.6 kHz at various strains (figure 2). (Note: for clarity some extraneous curves from Mason's original figure have been removed from figure 2.) Mason found that the internal friction (the inverse of the Q) was constant at 0.00005 (Q = 20000) up to a strain of about 0.003 after which the it rapidly increased (i.e., the loss increased and the Q decreased). This limiting strain corresponds to a stress of about 320 MPa [46 kpsi]. Mason found that the increase in internal friction was not necessarily reversed upon subsequent annealing.
(Note: These tests were conducted in an evacuated chamber which suggests that the samples were not cooled. Mason does not indicate the sample temperature. If cooling had been applied then perhaps higher strains might have been achieved.)
|
|
|
In low amplitude tests Mason found that the internal friction was independent of frequency up to 104 kHz and decreased "only slightly" at high temperatures (Mason's figure 9, p. 1931).
Variability
In Mason's work above the number of tested samples is not known so the variability is not known. However, Mason's figure 7 (p. 1931) shows that the internal friction for two well annealed samples differed by almost 2:1.
Wuchinich (3) reports a Q of ~5000 for two annealed samples. This is only 1/4 of the value reported by Mason (1).
Comparison to other materials
Aeroprojects conducted resonant tests on various metals to determine their acoustic losses (circa 1969). The tests measured the temperature rise of water that flowed through the center of a highly stressed 15 kHz horn (figure X).
|
|
|

The results (reported by Maropis) are shown in figure X. Note that the losses are only valid for the particular frequency and sample shape. However, comparisons among the various materials are still valid.
Unlike Mason's results for Ti‑6Al‑4V (figure 2) where the Q is constant up to a strain of about 0.003, the Aeroprojects data indicate that the loss continually increases with increasing strain, although the loss accelerates at higher strains. None-the-less, the Cavitron data shows that Ti‑6Al‑4V is superior to the tested steels. Although the loss of Ti‑6Al‑4V is inferior to beryllium copper, aluminum bronze, and monel K500, it may be less expensive and also have superior fatigue strength.
|
|
|

Modulus and wave speed - variation with diameter
Cylindrical stock
For annealed rod stock, various tests by Culp indicate that Young's modulus depends on the material's raw stock diameter (i.e., the diameter of the raw material from which the horn was machined).
|
|
|
The above data were mainly generated by analyzing a horn design with FEA and then adjusting Young's modulus until the FEA frequency agreed with the actual horn's measured frequency. The confidence in the results is reasonably high so the data scatter must likely be attributed to variations in the titanium material. This is a known problem with titanium. (See the further discussion below.)
Because the data scatter is fairly large, the trend indicated by the regression line is not absolutely confirmed (as indicated by the low coefficient of determination R²). However, if true then the thin–wire wave speed and the tuned length will be affected.
Using the regression equation for Young's modulus from figure 3, the thin-wire wave (√(E/ρ) speed can be calculated (figure 4). (Note: if the relation between Young's modulus and raw stock diameter is truly linear, then the thin-wire wave speed can't also be linear since it involves the square root of the modulus. However, the deviation from linear is insignificant over the range of interest.)
|
|
|
Data scatter
For the data of figure 3 there are three diameters that had a significant number of samples: 7.9 mm, 12.7 mm, and 38.1 mm. The following three graphs show the scatter for these diameters and the associated probabilities. For example, for the 38.1 mm diameter (figure 7c), 95% of the Young's moduli fall within a 9.6 GPa band with a mean of 111.8 GPa. (The raw data for the 38.1 mm diameter are given in appendix A.)
|
|
|
|
|
|
|
|
|
The following table summarizes the above graphical information. Note that the 95% probabilities were calculated by assuming a normal distribution of the data. This assumption is somewhat incorrect as indicated, in part, by the fact that the mean and median values for a given material diameter are somewhat different.
|
||||||||||||||||||||||||||||
|
Unfortunately, the data scatter shown in the above figures is not unusual for titanium. TIMET data (p. 14) for eight heats of Ti‑6Al‑4V sheet in both the longitudinal and transverse material directions (figure 8) show similar scatter . At room temperature the data scatter for both material directions is approximately ±2.8 GPa.
(From an orthotropic perspective, on average Young's modulus in the transverse direction (~118 GPa) is about 5% higher than in the longitudinal direction (~107 GPa) at room temperature.)
|
|
|
In the above chart, WQ = water quenched; AC = air cooled.
Data from Culp for an undisclosed titanium alloy (forged) show that Young's modulus can even vary along the length of a single bar. In these tests, the drive and pickup were both electrostatic so there was no attached transducer to contaminate the results.
|
||||||||||||||||||||||||||||||||||||
|
Repeated tests show that the data are very repeatable. Thus, the variation in Young's modulus along the bar must be due to actual variations in the material properties rather than testing errors.
Interestingly, Young's modulus for this material is higher in the longitudinal direction than in the long transverse direction. However, this conflicts with other known data for this material.
Plate stock
Since titanium is orthotropic, different moduli may be expected in each of the three material directions (longitudinal, transverse, short transverse). Although this information undoubtedly exists (aircraft manufacturers), it does not seem to be publically available.
Culp has compiled data for horns whose longitudinal material direction is parallel to the principal direction of vibration (the stud axis). The procedure and data are given in Appendix B. Excluding the one outlier at 132.4 GPa, the average modulus is 119.6 GPa. Except for the one outlier the data scatter is reasonable and does not appear to depend on the horn's thickness.
Poisson's ratio
A wide range of values have been reported for Poisson's ratio. These values are affected by the same factors as the wave speed and modulus (above).
- "It is difficult to give a reliable value for Poisson's ratio for titanium alloys since anisotropy leads to small differences in both elastic and shear moduli which, when taken together to calculate Poisson's ratio, can lead to values varying from 0.287 to 0.391 for annealed ASTM Grade 5 (Ti-6%Al-4%V) sheet. However, the generally accepted value for commercially pure titanium is 0.36 and that for ASTM Grade 5 is 0.31." (AZO Materials)
- "Poisson's ratio depends on material texture and measurement directions. Ten observations at TIMET, using a two element rosette strain gage, gave a mean value of 0.342 with a range of observations from 0.287 to 0.391." (TIMET, p. 15)
- Barile used a value of 0.32 for Ti‑6Al‑4V which he reported as "… an isotropic and homogeneous titanium alloy" (p. 161). It is unclear if this value was experimentally determined.
- For 1 mm thick Ti‑6Al‑4V sheet material, Lecompte reported an experimental value of 0.385 and a back-calculated FEA value of 0.36 ± 0.02.
- Culp has found that Poisson's ratios between 0.32 and 0.34 give reasonable results for FEA.
Fatigue
Fatigue curves show mean failures (i.e., for a given stress, the life at which 50% would have survived but 50% would have failed). However, in practice a 50% failure rate would not be acceptable. Therefore, the stress must be reduced in order to obtain acceptable life with a reasonable failure rate (perhaps <5%). The question is by how much the stress must be reduced.
In addition, laboratory fatigue (S‑NL) tests are conducted under highly controlled ("ideal") conditions. (Here, laboratory fatigue tests are designated as S‑NL to distinguish them from fatigue results that occur under real-world conditions. The S‑NL tests use carefully prepared specimens at relatively low frequencies - typically around 30 Hz. Such tests are sometimes referred to as Wӧhler tests after the early German investigator. See Juvinall, pp. 205 - 206.) When using S‑NL data to estimate the fatigue of a resonator, care must be taken to assure that the conditions are the same. Otherwise, the fatigue estimate for the resonator would need to be adjusted compared to the S‑NL data. This often results in a reduction in the estimate of allowable resonator stress. The following factors should be considered when comparing real-world fatigue to S‑NL data and when interpreting S‑NL graphs.
- Surface finish. S‑NL test specimens typically have a finely polished surface finish, often parallel to the specimen's axis. Horns would not normally receive such care so their lives could be shorter than the S‑NL test specimens at the same stress level.
- Surface treatments. Surface treatments include platings (which can either be beneficial or harmful) and shot peening (which may be beneficial under certain circumstances).
- Stress concentration. S‑NL test specimens are often machined with notch to give a specific stress concentration. This will be indicated if the sterss concentration factor Kt is greater than 1.0.
- Machining. The horn may have machining defects (e.g., unblended radii) that are not present in the S‑NL specimen. If these defects are present in a highly stressed region then the allowable stress would have to be reduced.
- Test direction. Fatigue may be sensitive to the grain direction. See below.
- Frequency. Ultrasonic fatigue tests often show reasonable agreement with conventional low-frequency S‑NL fatigue tests (see below for an example) but this issue is not completely resolved. See Wells. Also see Neppiras (2) (p. 707) who states, "Measurements have confirmed that the fatigue limit is a function of the operating frequency [comparing ultrasonic results to low-frequency tests]." (Note, however, that this statement does not specifically refer to titanium.)
- Test mode. Rotating beam and reversed bending tests allow higher stresses than axial tests because the interior of the S‑N specimens does not see the full surface stress. Unlike axial fatigue specimens, The stresses in rotating beam and bending specimens are highest on the surface and reduced stressed in the interior. Therefore, these specimens may allow higher stresses than axially stressed specimens where the stresses are uniform across the cross-section. Therefore, to account for axial loading Juvinall (p. 231) suggests reducing the the endurance limits S'n of rotating beam and reversed bending tests by about 10%.
- Size. Larger parts generally allow lower stresses because there is more material (and potention defects) from which fatigue cracks may start. See Juvinall (p. 231).
- Material's processing (forged, extruded, rolled, etc.). See below.
- Material shape (rod, bar, plate, sheet)
- Heat treatment. Titanium's heat treatment will affect the endurance limit. For example, matweb.com gives 510 MPa for generic annealed unnotched Ti–6Al–4V at 107 cycles versus 700 MPa for STA (solution treated and aged). However, see appendix E for important notched results. (Important: the test conditions were not specified. Therefore, these endurance limits should only be used for comparison.)
- Notch sensitivity. Some materials have good fatigue performance in the unnotched condition but their performance deteriorates relatively significantly in the notched condition. See appendix E for the notch sensitivity of Ti–6Al–4V STA.
- Residual stresses. Residual tensile stresses may reduce the fatigue life. On the other hand Donachie (p. 177) notes, "One further observation about titanium alloys is that fatigue data reported in the literature often may be on material with favorable surface residual stress induced by turning, milling, etc. Fully stress-relieved or chem-milled surfaces probably have fatigue strengths below the reported alloy capabilities, because the latter have been biased upward by the favorable - that is compressive - stresses."
Note that some machining operations (e.g., harsh electro-discharge machining EDM (discussed elsewhere), harsh grinding) can induce high residual tensile stresses. - Static stresses. The allowable ultrasonic stress will be reduced when compressive static stresses are present. Such stresses can be significant when long medical probes are loaded transversely at the free end. (Static tensile stresses have no effect on fatigue.)
- Environment. Adverse environmental factors (temperature, corrosives, cavitation) may reduce the allowed stress. Note that elevated temperatures may arise from heat that is generated within the resontor material due to the ultrasonic vibration (i.e., hysteresis type heating) and from heat that is generated by the ultrasonic process (e.g., heat that is transferred from the melted plastic to the horn's face).
Effect of grain direction
Fatigue may be affected by direction of the grain relative to the principal stress. For example, see the graph of Boyer (p. 431) below. (Original source: Polmear, I. J., Light Alloys, American Society for Metals, Metals Park, OH, 1981, p. 193) Note that, unlike Bowen above, the longitudinal direction has considerably longer life than the long transverse direction.
The effect of cross rolling on fatigue is not known. However, given the critical reliability requirements of the aero-engine compressor blades for which it is used, one would assume that the fatigue performance would be exceptional.
|
|
|
Etching
The grain direction in titanium can be checked (either before or after machining) with Kroll's Reagent (1% HF (hydrofluoric acid), 12% HNO3 (nitric acid), balance water) which is available commercially.
Effect of processing
Fatigue may be affected by how the material is processed and the resulting microstructure. Figure 10 (Willertz, p. 341) shows this effect for fine grained α‑β, tested in pure water, where the lamellar performed significantly better than the equixed. The test samples were round so the material is not sheet but other information is not available. (Note, in this case, the general agreement between the results at conventional and ultrasonic frequencies.)
|
|
|
Machining
"Using the rating system based on AISI B1112 steel, the machinability of Ti 6Al-4V is rated at 22% of B1112. In general, low cutting speeds, heavy feed rates and copious amounts of cutting fluid are recommended. Also, because of the strong tendency of titanium to gall and smear, feeding should never be stopped while the tool and work are in moving contact. Non-chlorinated cutting fluids should be used to eliminate the possibility of chloride contamination. It should be noted that titanium chips are highly combustible and appropriate safety precautions are necessary." Details are available at Carpenter Technology Corporation.
Notes:
- Carbide tools are recommended.
Tapping
Titanium can be difficult to tap because it conducts heat poorly. This retained heat may result in chipped cutting edges and reduced tap life. In addition, titanium tends to seize the tap which which can cause galling and tearing of the threads; this may, additionally, cause small diameter taps to break.
Work hardening ---
Special taps are available for titanium.
|
|
|

Tap drill dia ---
The size of the pre-tapped hole will depend on such factors as the precision and condition of the drill and the type of equipment that is used to produce the hole (for example, CNC versus manually operated), etc. Hence, the limits of the drilled hole diameter should be specified rather than specifying a particular tap drill size.
Recommendations
- For consistency of material properties, always order material from the same vendor and, preferably, from the same manufacturer.
- Always specify the grain direction on the resonator drawing.
- Whereas some rectangular horns are too large for bar stock, most rectangular horns can be machined from plate stock. Therefore, for maximum consistency plate stock should be used for rectangular horns where possible.
- Where the material dimensions permit, cylindrical horns should be machined from cylindrical stock rather than plate stock. This is because, although the material properites may vary radially, there should be little variation circumferentially so the amplitude variation at any given radius should be minimized. (If the horn were machined from plate stock with the stud axis in the thickness (short transverse) direction, then the amplitude at a given radius could vary due to differences in the plate's properties in the longitudinal and long-transverse material directions, both of which are transverse to the stud axis.)
- In order of preference, the grain direction (relative to the resonator's principal stress direction) should be specified as: 1) short transverse, 2) longitudinal, 3) long transverse. However, short transverse may not be available in sufficient size.
- For Ti‑6Al‑4V:
- Use annealed material because it has better fatigue and lower loss than STA material.
- Young's modulus
- For cylindrical stock Young's modulus may be taken from figure 3.
- For plate stock where the the grain direction parallel to the principal direction of vibration, 119.6 GPa ia a reasonable first estimate for Young's modulus.
- Maximum permitted stress. Considering both fatigue and loss, the maximum stress should generally be limited to 320 MPa [46 kpsi] — 350 MPa [50 kpsi]. Critical applications may require a lower stress.
- Fatigue. Considering the many variables involved in fatigue, then for annealed Ti‑6Al‑4V whose principal vibration is parallel to the longitudinal grain direction, the literature and experience suggest that (as a rough rule of thumb) the maximum peak alternating stress should not exceed 350 MPa [50 kpsi] under normal conditions (reasonable surface finish, no residual stress, no corrosives, etc.), assuming essentially infinite life is needed. Special circumstances may allow a somewhat higher stress or require a lower stress. (Wuchinich (4) (p. 7) asserts, "The safe value of vibrational stress has been determined by experimentation to be one-third the value of the yield stress (the stress at which the metal begins to irreversibly deform)." This would give a maximum safe stress of approximately 300 MPa [43 kpsi].).
- Loss. As discussed above, the loss can quickly increase for strains above 0.003 which corresponds to a stress of about 320 MPa [46 kpsi] (but depending on Young's modulus which can vary somewhat). Additional cooling (e.g., water for surgical instruments) may allow greater stress for slender resonators. However, additional surface cooling on relatively thick resonators (e.g., bar horns) may not be effective in removing the heat because titanium has poor thermal conductivity. In this case reduced stress may be necessary.
Appendix A - Young's Modulus for Ø38.1 mm Ti‑6Al‑4V Rod
|
||||||||||||||||||||||||||||||||||||||||||||||||||||||||||||||||||||||||||||||||||||||||||
|
Notes:
- The data are from Culp.
Appendix B - Young's Modulus for Ti‑6Al‑4V Plate
Longitudinal grain direction
A series of horns was machined with the grain direction parallel to the principal direction of vibration. Each horn was analyzed with FEA whereby Young's modulus was adjusted until the FEA frequency agreed with the actual horn's measured frequency. Young's modulus was thus determined as though the material were isotropic although the material is likely orthotropic.
|
||||||||||||||||||||||||||||||||||||||||||||||||||||||||||||||||
|
Notes:
- The data are from Culp.
- All horns are bar horns.
- Horn dimensions are listed as "face width" x "face thickness" x "back thickness".
- All dimensions are rounded to the nearest mm.
- TIMET is a titanium manufacturer. President Titanium is a vendor that supplies titanium from various sources.
- The 35 kHz 83 mm x 5 mm x 23 mm horn has a modulus of 132.4 GPa. This appears to be an outlier. If this datum is excluded then the average modulus changes to 119.6 GPa (–0.5%).
- With this type of test, the attached transducer may have some effect on the frequency and, hence, on the determined modulus.
Appendix C - Titanium with Low Young's Modulus
The following titanium have a modulus that is appreciably lower than normal. Niinomi (2) (p. 2) notes, "Developing the fatigue strength and simultaneously lowering Young’s modulus is somewhat difficult because they are opposite natures when the bonding force between atoms is considered." Many of the alloys contain niobium (Nb).
These titanium may be used for bone implants because their low modulii more nearly match that of bone. These titanium could also be useful where a short ultrasonic probe is needed.
The following list is not comprehensive.
Ti‑29Nb‑13Ta‑4.6Zr (TNTZ)
Niinomi (2) reports a modulus of 60 GPa (55 GPa if severely cold worked). Under certain conditions the fatigue strength of this material is comparable to Ti‑6Al‑4V ELI (Niinomi, figure 4, p. 3). This material may be used for biomedical applications. (Also see Niinomi (1).)
Ti‑(5, 10, 15)Nb‑9Zr
Liu investigated this material for 5%, 10%, and 15% concentrations of Nb. The stress-strain curves are shown in figure C1 along with the modulii. Note that the CR(cold rolled) material has the highest ultimate strength and is therefore also likely to have the highest fatigue strength. Lui suggested this material as a potential candidate for biomedical applications.
|
|
|
Appendix D - Titanium for Biomedical Use
ASTM lists the following titanium alloys for implant use. Presumably they could also be used for ultrasonic surgical probes if their ultrasonic performance were acceptable.
- Ti unalloyed
- Ti-6Al-4V
- Ti-6Al-4V ELI
- Ti-6Al-7Nb
- Ti-13Nb-13Zr
- Ti-12Mo-6Zr-2Fe
- Ti-15Mo
- Ti-3Al-2.5V
- Ti-15Mo-5Zr-3Al (solution treated)
- Ti-12Mo-6Zr-2Fe
- Ti-35.3Nb-5.1Ta-7.1Zr
- Ti-29Nb-13Ta-4.6Zr (solution treated; see Niinomi (2), Niinomi (1))
- Ti-29Nb-13Ta-4.6Zr (aged; see Niinomi (2), Niinomi (1))
Appendix E - Other Titanium
Ti‑6Al‑4V ELI (Extra Low Interstitial)
Ti‑6Al‑4V ELI is a higher-purity ("extra-low interstitial") version of Ti‑6Al‑4V, with lower specified limits on iron and the interstitial elements carbon and principally oxygen. This yields superior toughness, especially at low temperatures. (See below for some properties.)
There is some suggestion that this material may be superior for ultrasonic applications, either through a more consistent Young's modulus or better fatigue strength. Osgood (figure 4.49, p. 422) shows the unnotched fatigue strength as 635 MPa [92 kpsi] at 107 cycles versus 515 MPa [75 kpsi] for Ti‑6Al‑4V, a 23% improvement. (Osgood does not specify the material's condition.) On the other hand, matweb.com gives 300 MPa [44 kpsi] versus 510 MPa [74 kpsi] (a 41% decrease) for annealed material under the same conditions.
Ti‑6Al‑4V STA (Solution Treated and Aged)
Solution treating and aging is a common method for increasing the strength of Ti‑6Al‑4V. (See TIMET (p. 10) for details.) The following table from matweb.com compares Ti‑6Al‑4V STA with annealed Ti‑6Al‑4V. (ELI material has also been included for completeness.) In most respects Ti‑6Al‑4V STA appears superior. For example, its unnotched (Kt = 1.0) fatigue strength is 37% higher. However, many ultrasonic resonators have significant "notches" (stress concentrations) due to radii from slots, flutes, etc. The matweb data show that for a stress concentration factor Kt = 3.3, Ti‑6Al‑4V STA actually has 33% lower fatigue strength than annealed. (Osgood (pp. 440‑442) notes that titanium is very notch sensitive and that heat treatment intensifies this notch effect.)
|
||||||||||||||||||||||||||||
|
Contrary to the above, however, a graph from Boyer (p. 430) below indicates that STA has superior fatigue in both the unnotched as well as the notched conditions. (Original source: Metals Handbook, 9th Edition, Volume 3, Properties and Selection: Stainless Steels, Tool Materials and Special‑Purpose Metals, American Society for Metals, Metals Park, OH, 1980, p. 389) Hence, the fatigue performance of STA compared to annealed is unclear. However, as discussed previously, the STA material has higher loss (lower Q) than the annealed material which may therefor limit its ability to operate at high stress.
|
|
|
Ti‑6Al‑4V sintered
In theory, sintering could be used to produce a resonator to near-net shape. Wuchinich (3) tested a sample of sintered Ti‑6Al‑4V at 20 kHz. The Q was ~15000 up to a stress of 360 MPa (strain = 0.0030) after which it dropped to 11500 at 410 MPa (strain = 0.0034) (Wuchinich figure 8). When a separate sample was annealed (730 °C for one hour, then air cooled) the Q dropped to ~5000. Fatigue performance is not known.
Ti‑7Al‑4Mo
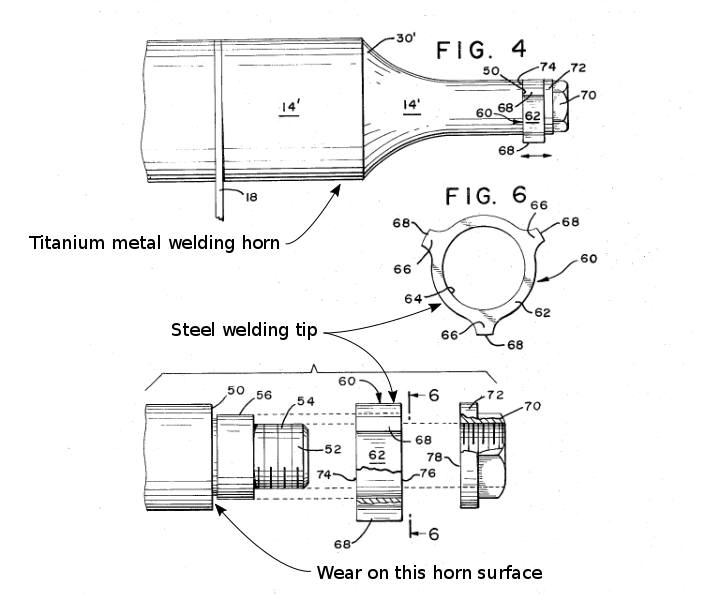
Branson Ultrasonics uses Ti‑7Al‑4Mo (7% aluminum, 4% molybdenum), typically from TIMET. Branson switched from Ti‑6Al‑4V in the early 1970's:
- During the development of their ultrasonic metal welder, the steel welding ring (in the region of the welding lobe) would eventually cause the adjacent horn interface to deteriorate (figure C2). Ti‑7Al‑4Mo seemed to give improved life.
- Ti‑7Al‑4Mo seemed to reduce the variability in tuned lengths (i.e., a more consistent modulus).
|
|
|
The literature suggests that this material may have higher fatigue strength than Ti‑6Al‑4V. One source (reported by Culp) found that tips made of Ti‑7Al‑4Mo had superior thread life compared to those made of Ti‑6Al‑4V.
For cylindrical stock, Young's modulus is about 1 GPa higher than Ti‑6Al‑4V (per Culp). Thus, horns made of this material will tune somewhat longer than those from Ti‑6Al‑4V and the stress will be somewhat higher.
Ti‑6Al‑4V‑2Sn
Wuchinich (3) tested this material at 20 kHz where it survived repeated 6 million cycle operation at 414 MPa. However, note that the specimen was water cooled so that a reasonable temperature could be maintained through its 3.2 mm diameter. Also:
- The sample was annealed for one hour at 700 °C followed by air cooling.
- A single sample was tested so additional tests may be warranted.
- Young's modulus was measured as 99.3 GPa. Thus, this material will tune somewhat shorter than Ti‑6Al‑4V whose modulus for this size is ~107 GPa.